How we develop and test complex OpenVidu clusters in our laptops
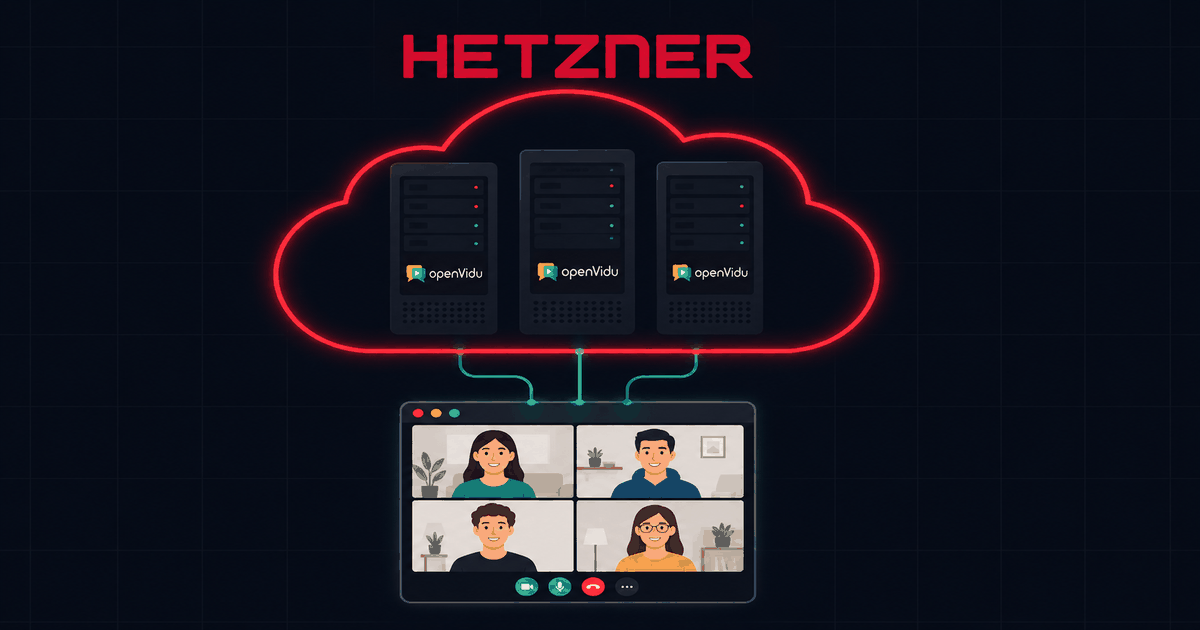
Any modern software system of a certain size that aims to be scalable and fault-tolerant consists of multiple services running on different nodes. OpenVidu is no exception, and it goes even further: as a real-time system, there are other factors that become critical: shared state, concurrency, and response time.
Developing and testing such a distributed system is not trivial. In this post, we will explain how we are able to replicate production OpenVidu clusters on a single machine using Docker-in-Docker. This allows us to test and find bugs that only appear in a distributed environment, without the need for multiple VMs or physical machines.
The idea is that this short post will serve as inspiration for developers and sysadmins who may face similar challenges when working with distributed systems and need a practical solution to chaos test them, in a cost-effective and efficient way.