Skip to content

Research#

Debugging WebRTC with an AI agent and Grafana MCP
Debugging WebRTC with an AI agent and Grafana MCP: read-only Grafana, a broken deployment, and an agent that works through the metrics to find each root cause

What if you gave an AI agent nothing but read-only access to your Grafana, pointed it at a WebRTC deployment it had never seen, and asked what was broken? No shell, no source code, no config files, nothing but the dashboards and logs any on-call engineer would stare at. Could it actually find the root cause?

That is the experiment we ran at OpenVidu. We took a real OpenVidu deployment, broke it on purpose in five different ways, and handed a blind Claude Code session a single vague complaint and a link to Grafana. This post walks through what it found, where it shone and where it fell flat, and it ships with a companion repo so you can reproduce every bit of it yourself.
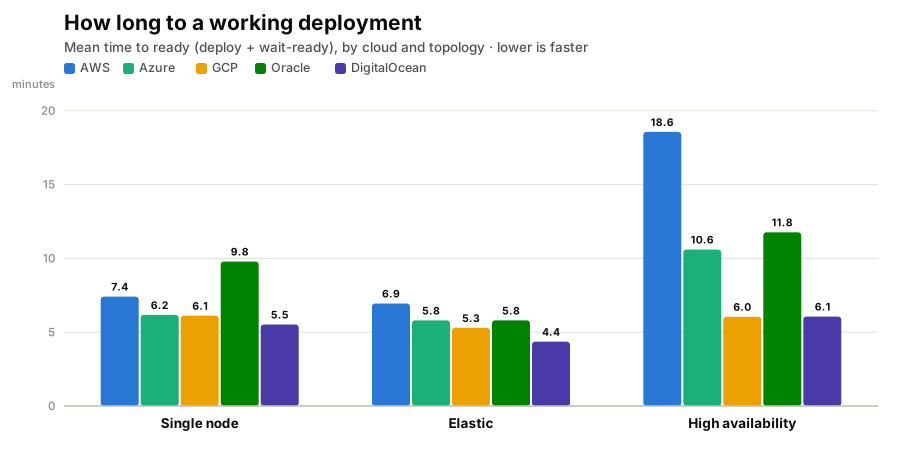
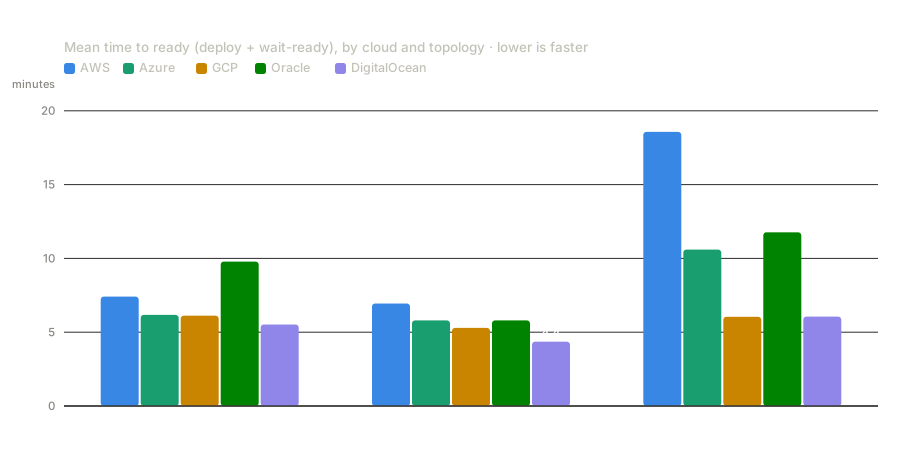
We deployed the same video platform on five clouds and timed it: 5 minutes to 20, and the slow ones are slow for a reason

Mean time to a working deployment, by cloud and topology Mean time to a working deployment, by cloud and topology

"How long does it take to deploy?" sounds like a trivia question until you're the one watching a progress bar, wondering whether it's stuck. So we stopped guessing and measured it.

We built a tool, ov-cloud-tester, that deploys the same self-hosted WebRTC video stack on all five major clouds — AWS, Azure, Google Cloud, Oracle Cloud and DigitalOcean — in three topologies (single node, elastic, and high-availability), tears it down cleanly, and times the whole thing. We ran it many times per cloud and looked at both the averages and every individual run. The headline: standing up a working deployment ranges from about 5 minutes to 20, DigitalOcean is consistently the fastest and Oracle the heaviest — and the why, plus which clouds are actually predictable, turns out to be more interesting than the ranking.