Debugging WebRTC with an AI agent and Grafana MCP#
What if you gave an AI agent nothing but read-only access to your Grafana, pointed it at a WebRTC deployment it had never seen, and asked what was broken? No shell, no source code, no config files, nothing but the dashboards and logs any on-call engineer would stare at. Could it actually find the root cause?
That is the experiment we ran at OpenVidu. We took a real OpenVidu deployment, broke it on purpose in five different ways, and handed a blind Claude Code session a single vague complaint and a link to Grafana. This post walks through what it found, where it shone and where it fell flat, and it ships with a companion repo so you can reproduce every bit of it yourself.
Debugging web apps is hard, debugging WebRTC apps is harder#
Most web developers live in basic HTTP backend APIs, frontend code, and database queries. The network environment, where the media actually flows, stays someone else's problem right up until a call breaks. WebRTC drags all of it into the foreground: ICE, DTLS, the SFU, packet loss, jitter, bandwidth, CPU. When something fails, the cause is usually buried somewhere in that stack, and reading it takes experience most teams simply don't have.
We know that pain, which is why every OpenVidu deployment ships with a full observability stack (Grafana, Prometheus, Loki) so our users can see what their media servers are actually doing. Turning those logs and metrics into a diagnosis, though, still takes a human who knows where to look.
So we tried handing that job to an AI agent. This is known as AIOps, using AI to operate and troubleshoot running systems. We ran a small, informal test to see what an agent can do.
An important note on privacy
When you hand an agent your metrics and logs, that data leaves for the model provider. If your observability carries sensitive information (room IDs, IPs, user data), make sure you use a provider with a solid privacy policy and a no-training-on-your-data commitment. And if you'd rather nothing leaves your network at all, you can always run the agent harness with a local model: same workflow, same MCPs, without a single log going out.
How we ran it#
An agent harness (here, Claude Code) normally lets an LLM run commands, write files, and act on a machine on its own. We took all of that away. The agent got exactly one tool: the Grafana MCP (Model Context Protocol, the standard way to give an agent access to a tool) pointed at the deployment's Grafana in read-only mode. No shell, no files, no source code, no config. We launched it with --strict-mcp-config so no other tool could load, disabled the Bash and file tools, and put only two things in the prompt: the operator's one-sentence complaint and the Grafana URL. The agent had no context about the underlying issue.
The deployment under test is a real OpenVidu Single Node Community stack (the free edition) running inside a simulated VM, openvidu-fake-vm , with the observability module turned on. The VM answers on a real, publicly trusted HTTPS name built from its IP, https://10-5-0-3.openvidu-local.dev, so there is no /etc/hosts editing and no self-signed certificate warnings.
We broke it in five ways, one at a time:
- Blocked media ports (ICE): calls connect, but nobody can see or hear anyone.
- Network congestion: packet loss and jitter on the outbound media path.
- Redis down: the coordination plane disappears, so new rooms and recordings stop.
- An ingress fed a bad stream key: the RTMP publish never lands in the room.
- Recordings refused: a bogus "CPU exhausted" error caused by a bad config value.
Each fault ran twice, with the same prompt, the same deployment, and the same model, a small and inexpensive one (Claude Haiku 4.5). The only thing that changed between the two runs was a bit of OpenVidu domain knowledge: a skill we wrote, openvidu-grafana-triage , that teaches the agent how OpenVidu's observability is laid out and what its signals mean. The first run used the bare MCP; the second added the skill. With the skill it got all five right; without it, it got two of them wrong.
Watching Claude debug, live#
For each fault you'll see three things: what we broke, the exact prompt the session started from (the operator's complaint, verbatim, is all it got, plus the Grafana URL), and what it found. The prompts are written the way someone with no inside knowledge of the system would write them, with no metric names and no hints. Where a prompt says HH:MM, that's the time the incident started, which the lab fills in with the real clock time on each run. Every prompt below lives verbatim in the lab's prompts/scenarios.yaml , alongside the answer key we graded each run against.
Fault 1: Blocked media (ICE)#
What we broke: we firewalled off the WebRTC media ports on the machine. Signaling still worked, so people joined the room but couldn't see or hear each other.
"Our video calls are broken since about HH:MM, people join the room but nobody can see or hear anyone. It worked earlier today. You've got access to our Grafana at https://10-5-0-3.openvidu-local.dev/grafana/. Can you dig in and tell me what's going on?"
What it found: both sessions localized it correctly. They saw participants climbing while livekit_packet_bytes stayed flat, jumped to the logs, found ICE/DTLS timing out (context deadline exceeded, "Failed to ping without candidate pairs") and concluded (correctly) that the media path was unreachable and it was a server-side networking problem, not the callers'.
But neither session could see the firewall rule itself (a dropped packet logs no reason), so both pinned the cause on the nearest visible thing, the SFU advertising Docker-internal IPs (10.5.0.3, 172.17.0.1) as ICE candidates, and recommended fixing that config so it advertised a reachable IP, plus opening the media ports. They pointed at the right area, which is exactly as far as observability reaches: it localizes the effect but not a cause that leaves no trace.
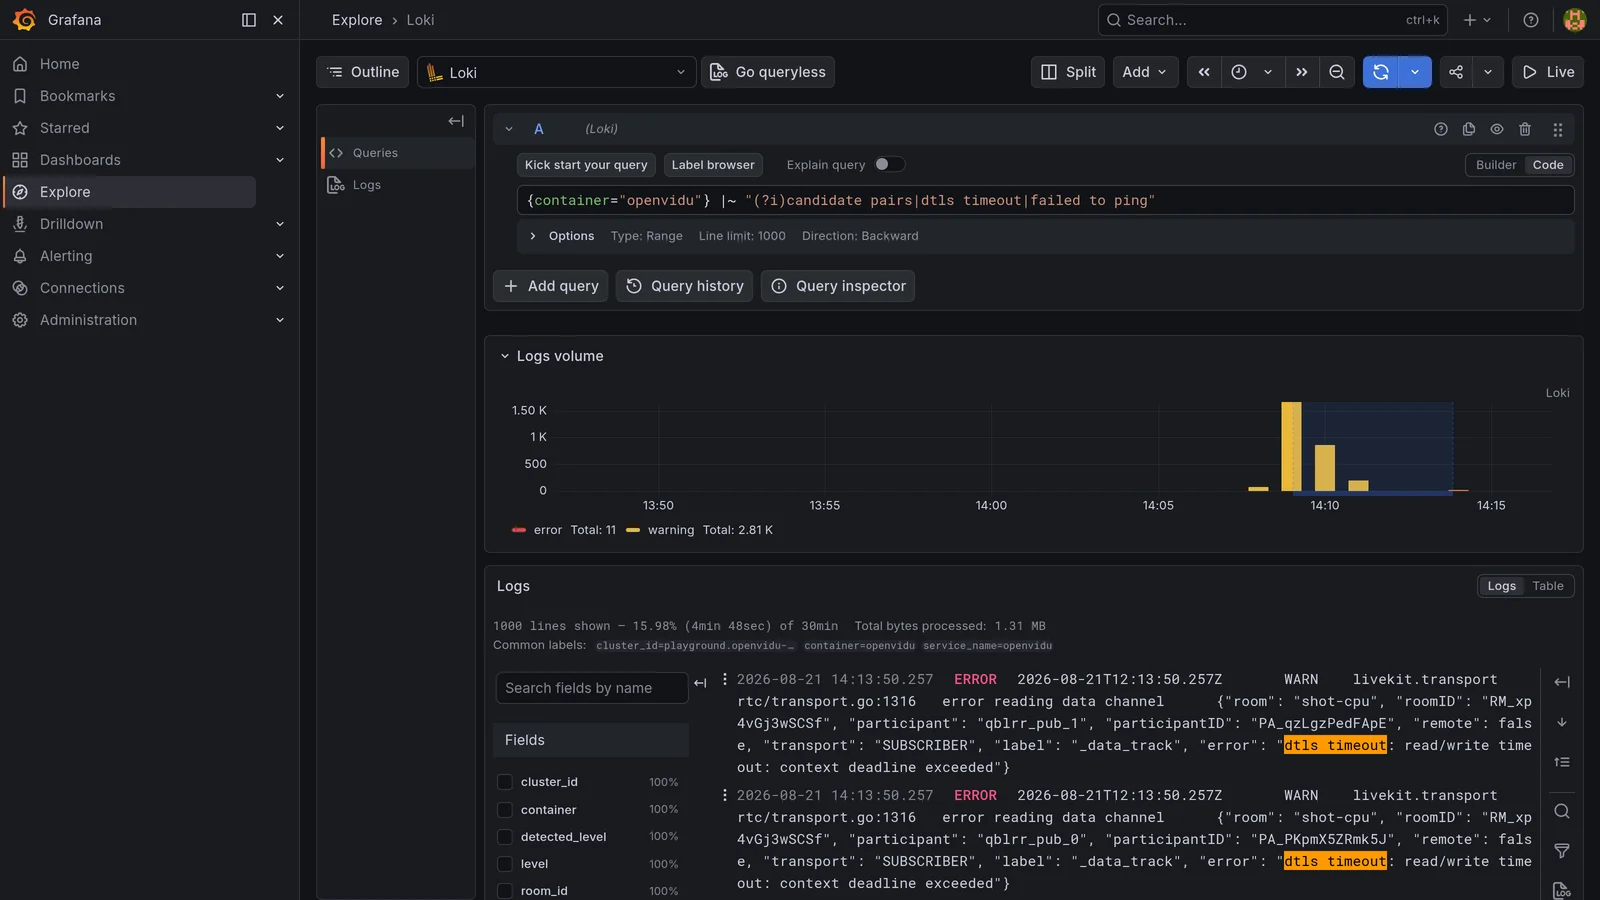
Loki, the instant media breaks: the SFU floods ICE/DTLS timeouts. People joined the room, but no media path could form.
Fault 2: Network congestion (choppy calls)#
What we broke: we injected packet loss and jitter (with tc netem) on the machine's outbound network path, simulating a congested uplink.
"Users say calls have been choppy and freezing for the last hour or so. Here's our Grafana: https://10-5-0-3.openvidu-local.dev/grafana/. Is the problem on our side or theirs?"
What it found: the skilled session answered the operator's real question, "us or them?", correctly: it's us. It split the quality metrics by direction and saw a clean, one-directional story: 0% loss on the uplink, 12→23% loss on the downlink with jitter and a burst of NACK/PLI retransmits, all at ~7 Mbps and ~4% CPU, so not capacity, and not the callers' networks (a client problem wouldn't be systematic across every subscriber).
That's where the skill mattered. The skilled session correctly identified it as a server-side problem, not the callers. The bare session was unreliable: in repeated runs it often pinned the blame on the users' own networks, the confidently wrong answer that would have sent you chasing your customers instead of your server.
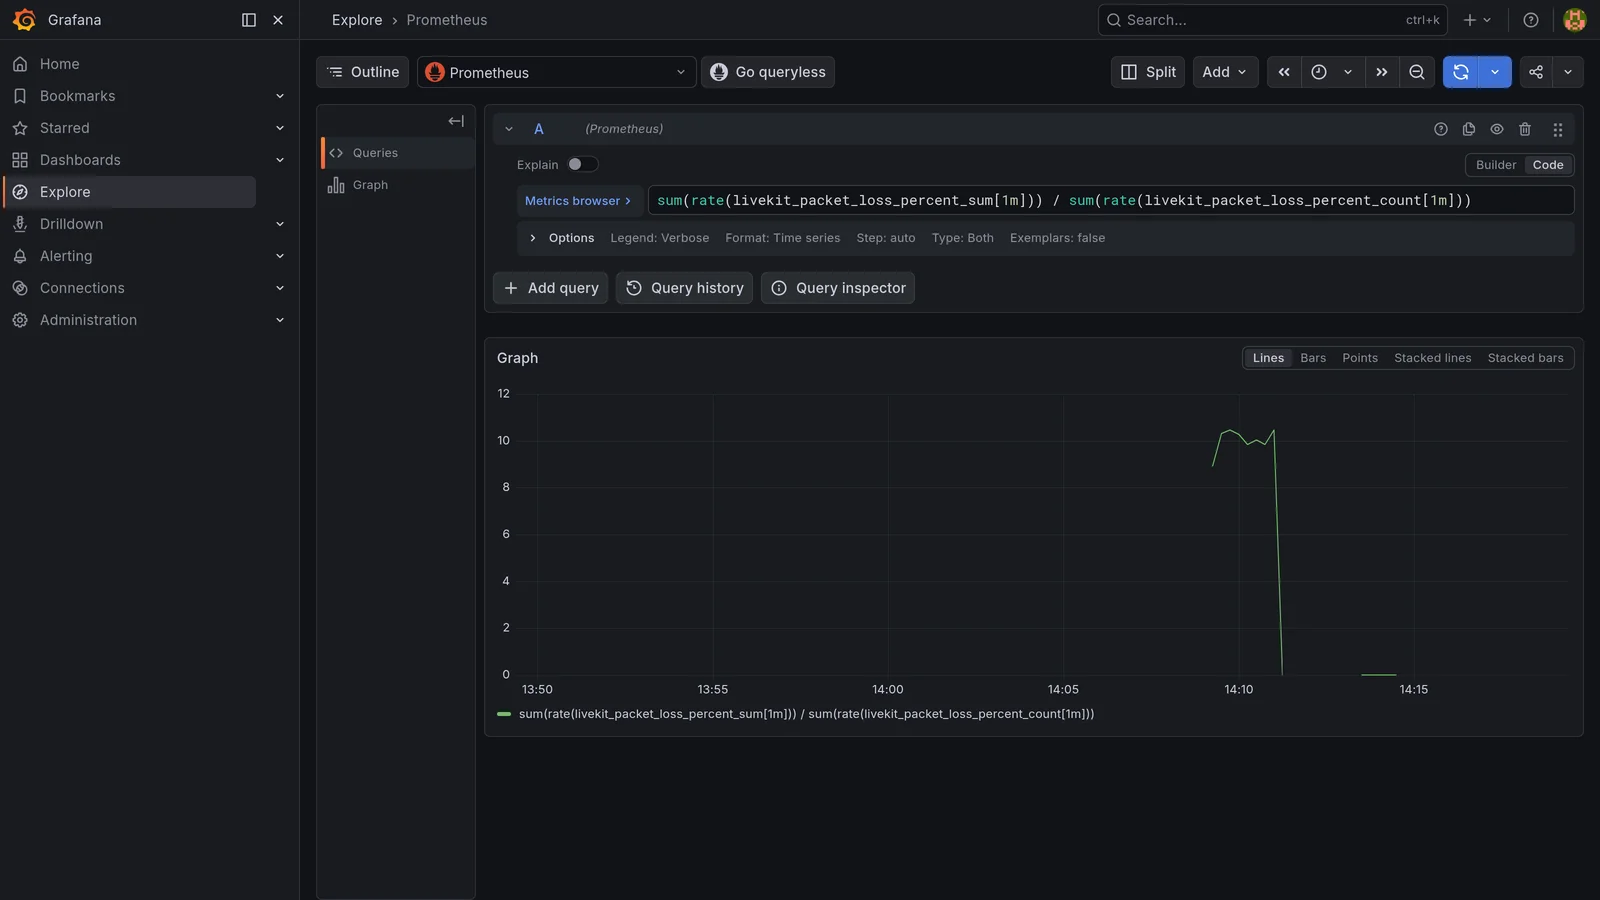
Metrics (Prometheus): average packet loss jumps from ~0 to ~10% the moment the link degrades. All of it is on the downlink; the uplink stays at 0, which is why the per-direction breakdown in the text reaches 23%. The calls connect fine, they just fall apart.
Fault 3: Redis down (coordination plane)#
What we broke: we killed Redis, which coordinates the whole deployment (room registration, routing, egress dispatch). Every service started logging connection refused on :7000.
"After a brief blip, no new rooms or recordings will start at all, existing stuff is limping. Here's Grafana: https://10-5-0-3.openvidu-local.dev/grafana/. What's broken?"
What it found: both diagnosed it correctly. Redis is unreachable on 127.0.0.1:7000, and both spotted the key sign: connection refused is an active reject, not a network timeout, so the process is down, not the network. The fix is to restart Redis. The one already-running call survives because media (RTP) flows peer↔SFU and never goes through Redis, while new rooms and recordings can't start.
Both reached the same right answer.
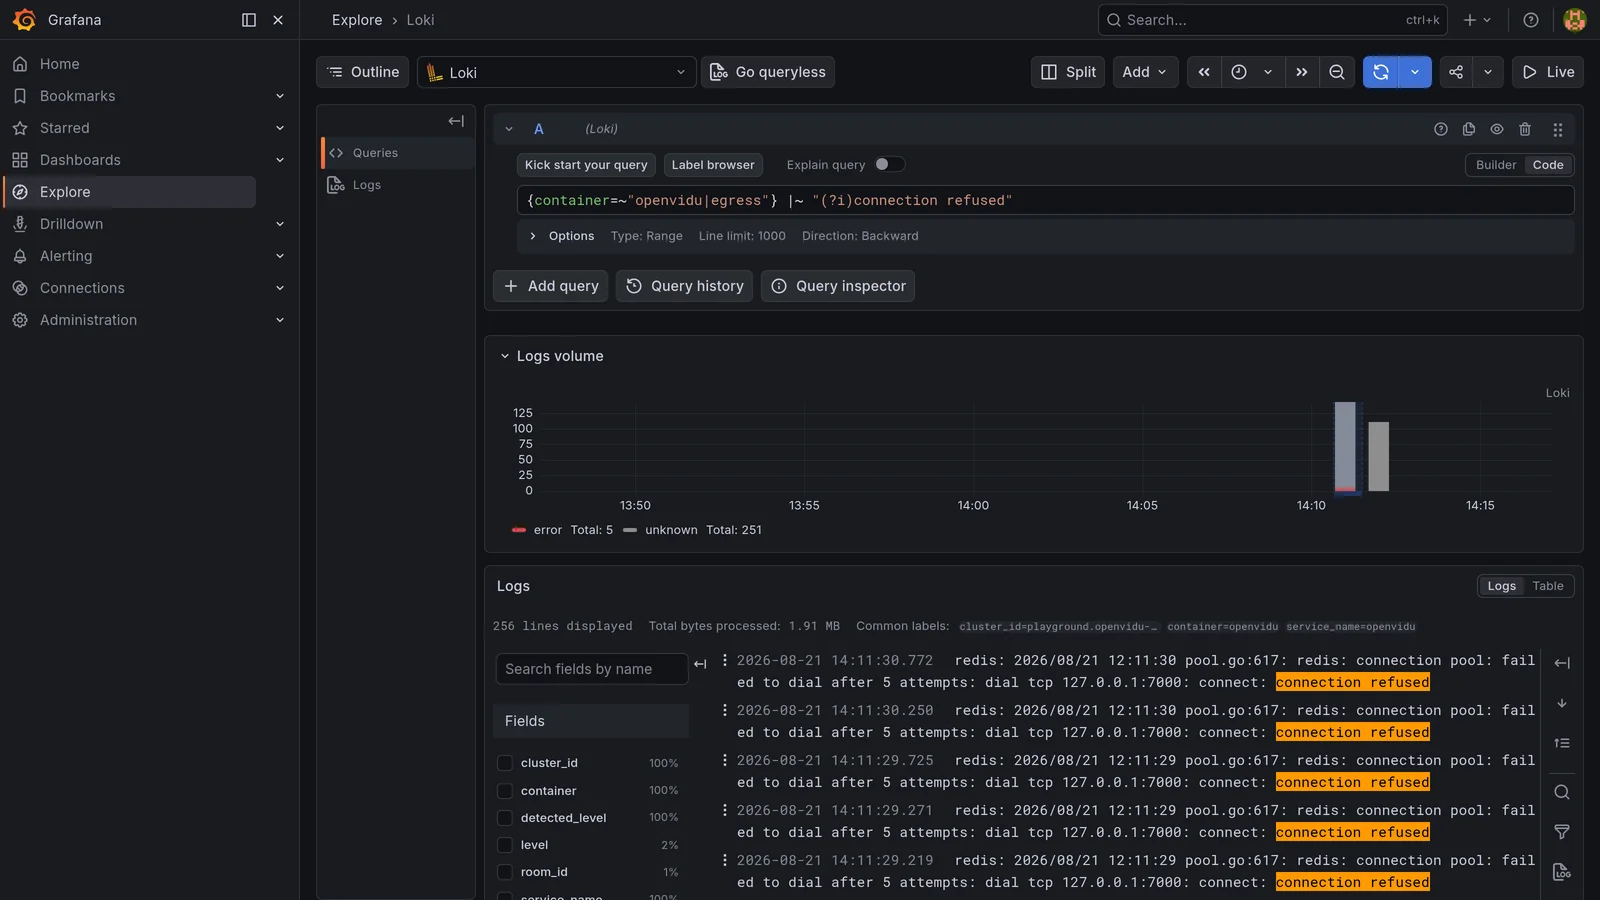
Loki: every service floods "connection refused" on 127.0.0.1:7000 the instant Redis dies. An active reject, not a timeout: the process is down, not the network.
Fault 4: Ingress RTMP with a bad stream key#
What we broke: we simulated a misconfigured streamer, an ffmpeg publishing to RTMP with the wrong stream key. Ingress rejects it every few seconds and the room stays empty. (Ingress has no metrics either, logs only.)
"We're trying to bring an RTMP stream into a room and it just won't come through, the room stays empty. Grafana: https://10-5-0-3.openvidu-local.dev/grafana/. Can you see why the ingest is failing?"
What it found: both solved it, fast and clean. The RTMP connection reaches the server but the publish is rejected with ingress does not exist for stream key BADKEY123. Both correctly called it a client-side problem, the encoder is using a key that was never issued; create the ingress via the API first, then point the encoder at the returned key, and confirmed the server pipeline (ingress, Redis, RTMP) is healthy. Here the signal, though logs-only, is explicit, so even the bare model reads it easily.
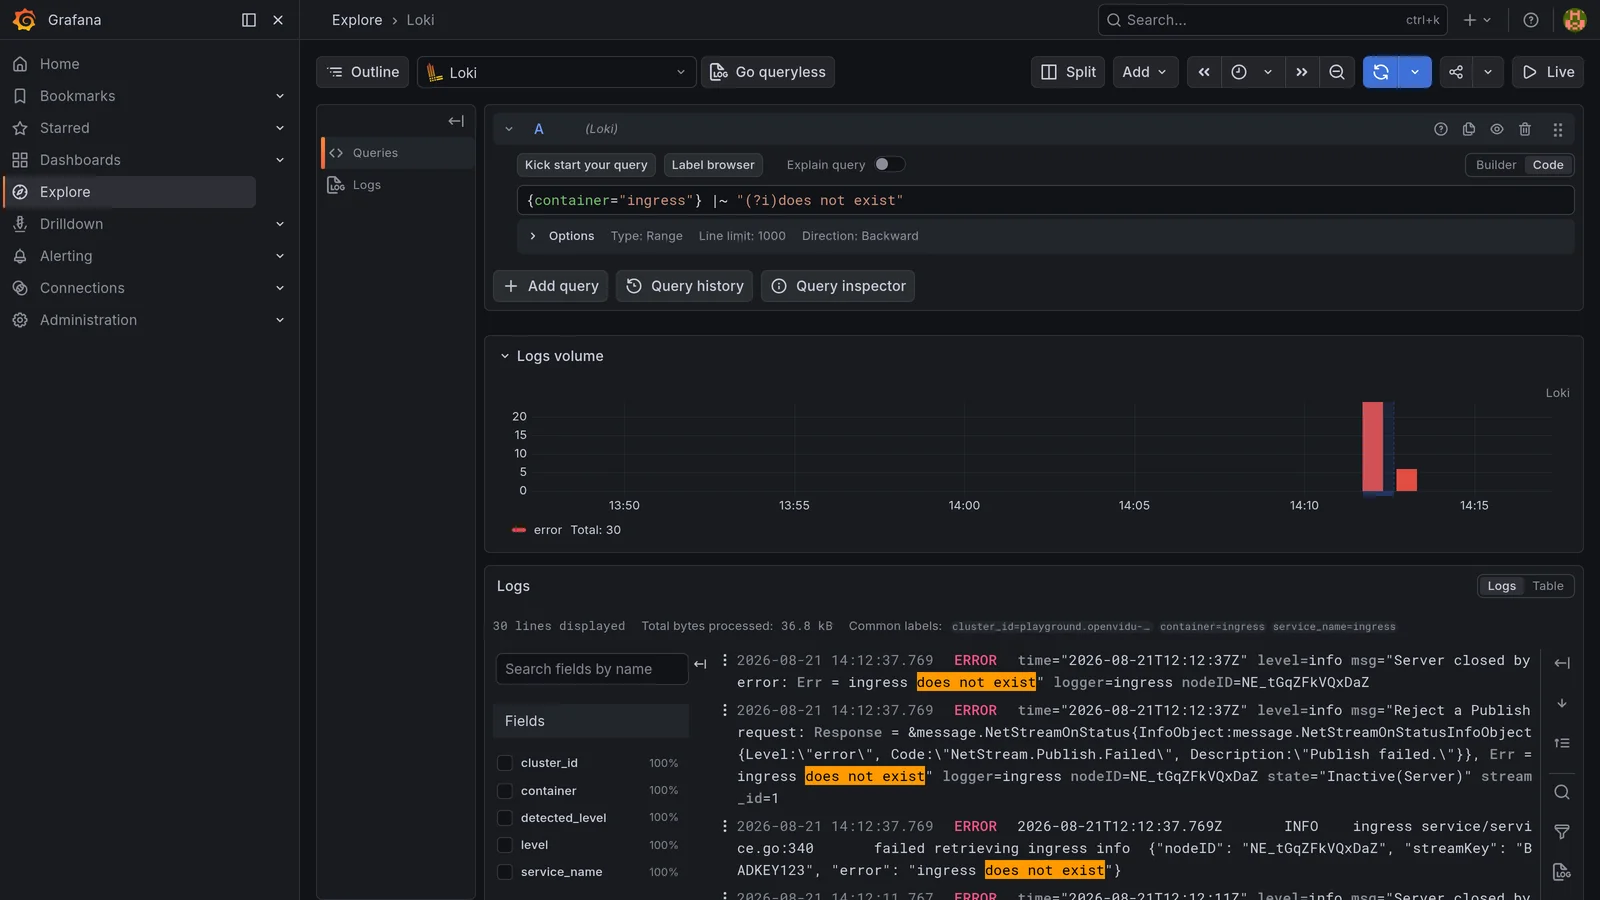
Loki: the ingress rejects the publish with "ingress does not exist" for stream key BADKEY123. A client-side misconfiguration, stated explicitly in the logs.
Fault 5: Recordings won't start (CPU "exhausted")#
What we broke: recordings are refused, but for a sneaky reason. OpenVidu's egress runs an admission check before it accepts a recording: it only takes the job if the node has enough spare CPU for it (documented here). We set the per-recording CPU cost in egress.yaml to an absurd 100, far more than the node's 16 cores, so the check can never pass and every recording is rejected with a "not enough CPU" error, even though the fake VM is basically idle.
It's the kind of mistyped config value that produces a real, scary-looking symptom. Calls are unaffected; only recordings die.
"Our recordings stopped working since about HH:MM, the calls themselves are totally fine, but nothing gets recorded anymore. Can you dig into Grafana (https://10-5-0-3.openvidu-local.dev/grafana/) and tell me why the recordings won't start?"
What it found: the skilled session got it, and (the nice part) it didn't take the error message at face value. It found egress logging "not enough cpu for some egress types" and "can not accept request … reason: cpu … not enough CPU", and the SFU logging StartEgress … request canceled after a 10-second wait.
Instead of concluding "add more CPU," the skilled session spotted the clue: the log says the job requires 100 CPUs while 16 are available, a nonsensical demand on an almost-idle host. It correctly diagnosed a bad cpu_cost config value (spotting the exact restart where the node came up with max cost: 100 instead of the healthy 2), and explicitly warned not to scale the hardware: "the config value is what's wrong, not the hardware." The bare session took the error at face value and recommended adding CPU, the expensive wrong fix.
A reassuring result: handed a loud, misleading error, the skilled session reasoned past it to the real cause.
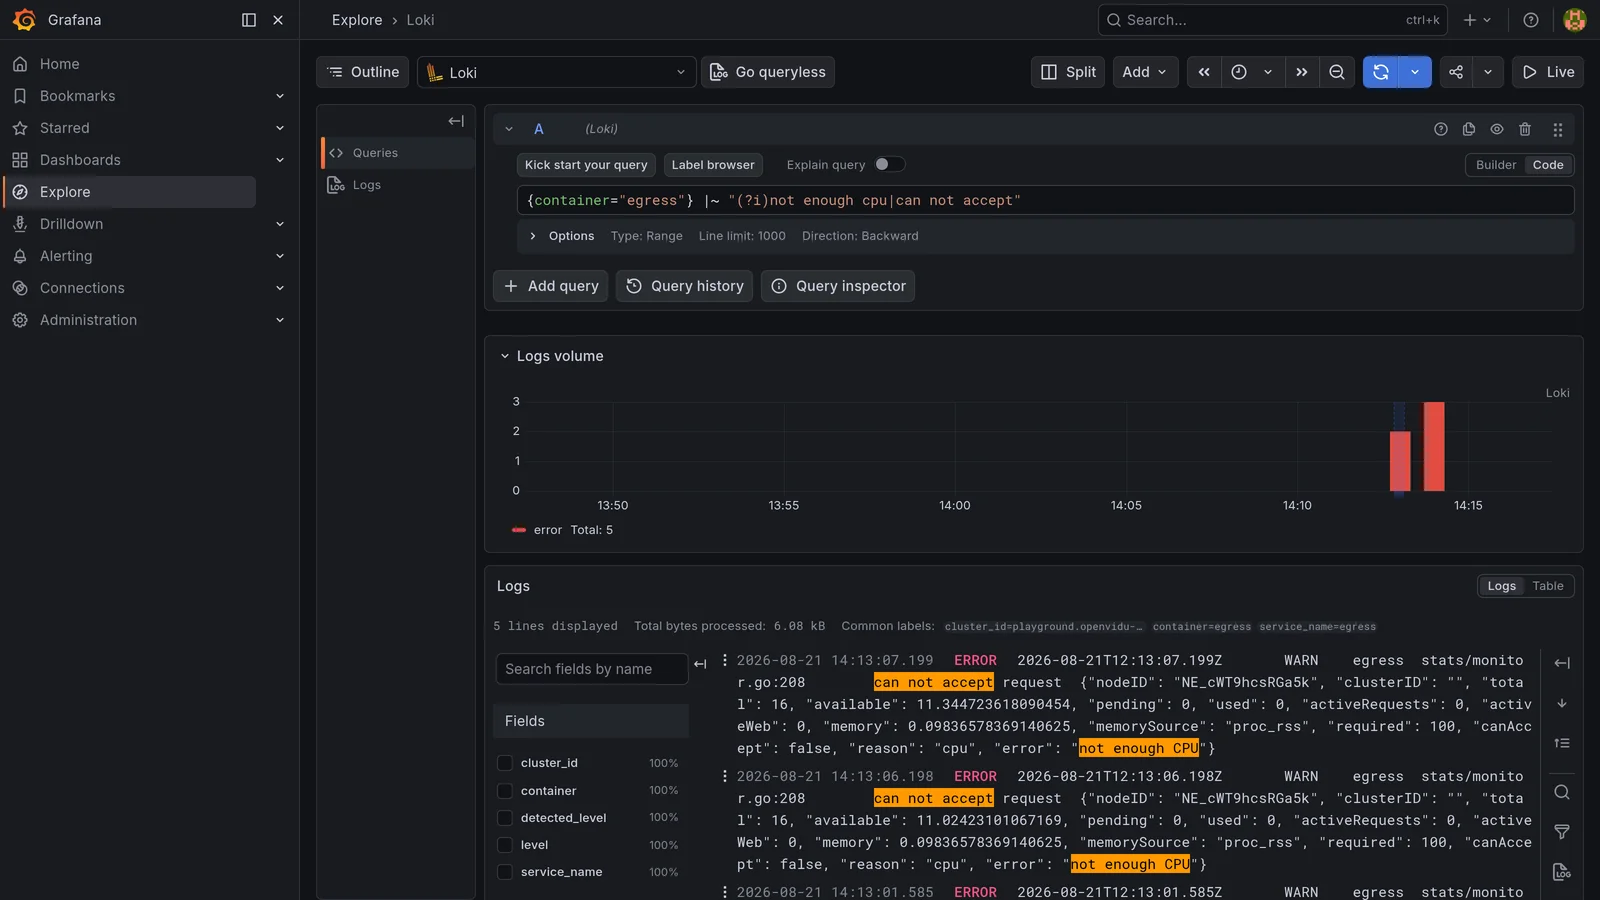
Loki: egress refuses every recording with "not enough CPU". Note "required: 100" against "available: 16", a nonsensical config value, not a real shortage.
The scorecard (and where it failed)#
One clear pattern emerged: with the skill, the agent got every scenario right. On the two tricky faults it was also the difference between the right root cause and a plausible but wrong reading.
We score each run in the usual AIOps terms, the stages an operator walks through when handling an incident:
- Detection (doesn't apply here): noticing that something is wrong. We always hand the agent a complaint, so it never has to discover the problem itself.
- Localization: pinning the failing component or subsystem, without necessarily knowing why.
- Analysis (root cause): going further and identifying the actual cause, the bad
cpu_costvalue, say, not just "recordings are failing." - Mitigation (doesn't apply here): fixing the problem on its own. Out of scope, since the agent can only read.
So the table scores each run at the highest stage it reached, Localization or Analysis.
| Fault | Signal | Bare MCP | With skill |
|---|---|---|---|
| Blocked media ports (ICE) | loud (metric + logs) | 🔍 Localization | 🔍 Localization |
| Network congestion | loud (metric) | ⚠️ often blamed the users | 🔍 Localization |
| Redis down | loud but logs-only | ✅ Analysis | ✅ Analysis |
| Ingress bad stream key | logs-only but explicit | ✅ Analysis | ✅ Analysis |
| Recordings refused ("CPU exhausted") | logs-only but explicit | ❌ blamed the hardware | ✅ Analysis |
The two tricky faults are where the skill mattered most: on congestion it reliably placed the fault on the server rather than the callers, and on the "CPU exhausted" recording refusal it saw the nonsensical config value behind the scary error instead of recommending more hardware.
Honest limits. A few things this approach cannot do:
- Some root causes are invisible to Grafana. A firewall rule doesn't log itself: in the ICE fault, the most either session could do was localize the effect ("media unreachable, check the firewall / the node's network config") and point at the right area; neither can read the
iptablesrule it will never see. When a cause leaves no trace in the data, expect a confident guess, not the truth, so check the infrastructure directly, outside Grafana. - A quiet environment full of benign warnings is a trap. The Docker-internal ICE candidates you saw in the first two faults are harmless, but the bare model chased them as if they were the cause. The skill helped precisely because it knew what "normal noise" looks like.
- It can be confidently wrong. The scariest failures weren't "I don't know," they were fluent, plausible, and wrong. Trust this to localize and to draft a hypothesis, then verify before you act.
- This is a lab. A single Dockerized node with synthetic load is not your production network; ICE behind real NAT behaves differently, and our sample is small. Treat it as illustrative, not a benchmark.
Reproduce the whole thing yourself#
Everything you just watched, you can run on your own machine. We packaged the experiment into a companion repo, openvidu-grafana-mcp-lab , that builds the whole lab and breaks it, one fault per command. The only things you need installed are Docker and Claude Code; the Grafana MCP and everything else run in containers, and there are no credentials to configure (the lab creates its own).
What it builds. A local OpenVidu Single Node Community deployment, the free edition, running inside a simulated VM, with the full observability module (Grafana + Prometheus + Loki). What makes this feel like a real deployment?
- The VM (
openvidu-fake-vm) comes up on a fixed IP and answers on a real HTTPS name built from it,https://10-5-0-3.openvidu-local.dev, with nothing to add to/etc/hostsand no certificate warnings. - Everything is fixed and scripted: the LiveKit keys, the Grafana admin, and a read-only Grafana token generated straight into the two
.mcp.jsonarms. Nothing to click.
Run it. Three commands from a cold start:
git clone --branch v0.1.0 https://github.com/openvidu-labs/openvidu-grafana-mcp-lab
cd openvidu-grafana-mcp-lab
./up.sh                    # VM + OpenVidu Community + read-only Grafana token (first run ~15 min)
Now pick a fault. ./scenario.sh list shows the menu; then one command leaves the deployment broken the right way, it warms up a healthy baseline first and then injects the fault, so the metrics tell the honest story of "it worked, then it didn't," and prints the operator's complaint, ready to paste:
The five faults in this post are, in order: F1 (blocked media), F2 (congestion), F5 (Redis down), F7 (ingress bad key), and F9 (recordings refused).
Then you play the on-call engineer. Point Claude Code at the read-only Grafana and hand it the line the script printed:
The lab is the same Single Node Community deployment the whole post is based on, so every fault and every signal you read about above is one you reproduce here yourself.
Set this up on your OpenVidu deployment#
Want this on your own OpenVidu? Four steps:
- Enable observability. Add
observabilitytoENABLED_MODULESinopenvidu.env(withGRAFANA_ADMIN_USERNAME/GRAFANA_ADMIN_PASSWORD) and restart. See the modules guide. - Create a read-only Grafana token: in Grafana, go to Administration → Users and access → Service accounts (or just search for Service accounts, the menu path varies slightly across Grafana versions), make an account with the Viewer role, and generate a token.
-
Point Claude Code at the Grafana MCP , read-only. Install the binary following the instructions in that repo, then drop a
.mcp.jsonnext to your project:{ "mcpServers": { "grafana": { "command": "mcp-grafana", "args": ["--disable-write"], "env": { "GRAFANA_URL": "https://<your-openvidu>/grafana/", "GRAFANA_SERVICE_ACCOUNT_TOKEN": "glsa_xxx" } } } }--disable-writeplus the Viewer token keep it read-only. Check it with/mcpin Claude Code and ask it to "list the datasources." -
(Optional) Give it the signal map: install the
openvidu-grafana-triageskill into.claude/skills/. That's the "with-skill" arm from the experiment above.
That's it: the same setup you saw throughout this post, pointed at your own deployment.
Conclusion#
Back to the question we opened with: can an AI agent, with nothing but read-only access to Grafana, understand what's wrong with a WebRTC deployment it has never seen?
The short answer is yes, and surprisingly well. In almost every scenario the agent worked through the metrics, jumped to the logs, and reached the right cause, often with just a handful of queries. With the domain skill it got every scenario right, and in the confusing congestion case it was the difference between correctly blaming the server and settling for a plausible but wrong explanation. It even saw through the misleading "not enough CPU" error, blaming the config rather than the hardware.
But it doesn't replace your judgment. An agent that only reads Grafana inherits Grafana's blind spots. What isn't in a metric or a log, it won't see, and when there's no signal it can hand you a beautiful, wrong answer with total confidence. It's great for first-pass triage, for answering "is it us or them?", for narrowing a vague complaint down to a subsystem and a node. For everything else, it's still you.
As for that developer who has never handled a media stream in their life: our bet is that tools like this lower the bar enormously. You no longer need to master ICE, DTLS, or the guts of the SFU to start understanding what's failing; you just need observability turned on and an agent to ask. It's all in a repo ready to reproduce, so break your own deployment, wire up Claude, and see for yourself.
One last thing: this is only a preview. We're preparing a set of MCPs and skills so coding agents can manage and operate OpenVidu stacks, and help you build applications on top of OpenVidu. The first of them is already here: the OpenVidu Agent Plugin. Follow OpenVidu's releases and the blog if you want to see the rest as it lands.
Now it's your turn: tell us what you find . And may your on-calls be boring. 😉