The Black Hole Node: how one full disk broke recordings in an entire WebRTC cluster (Bug stories #1)#
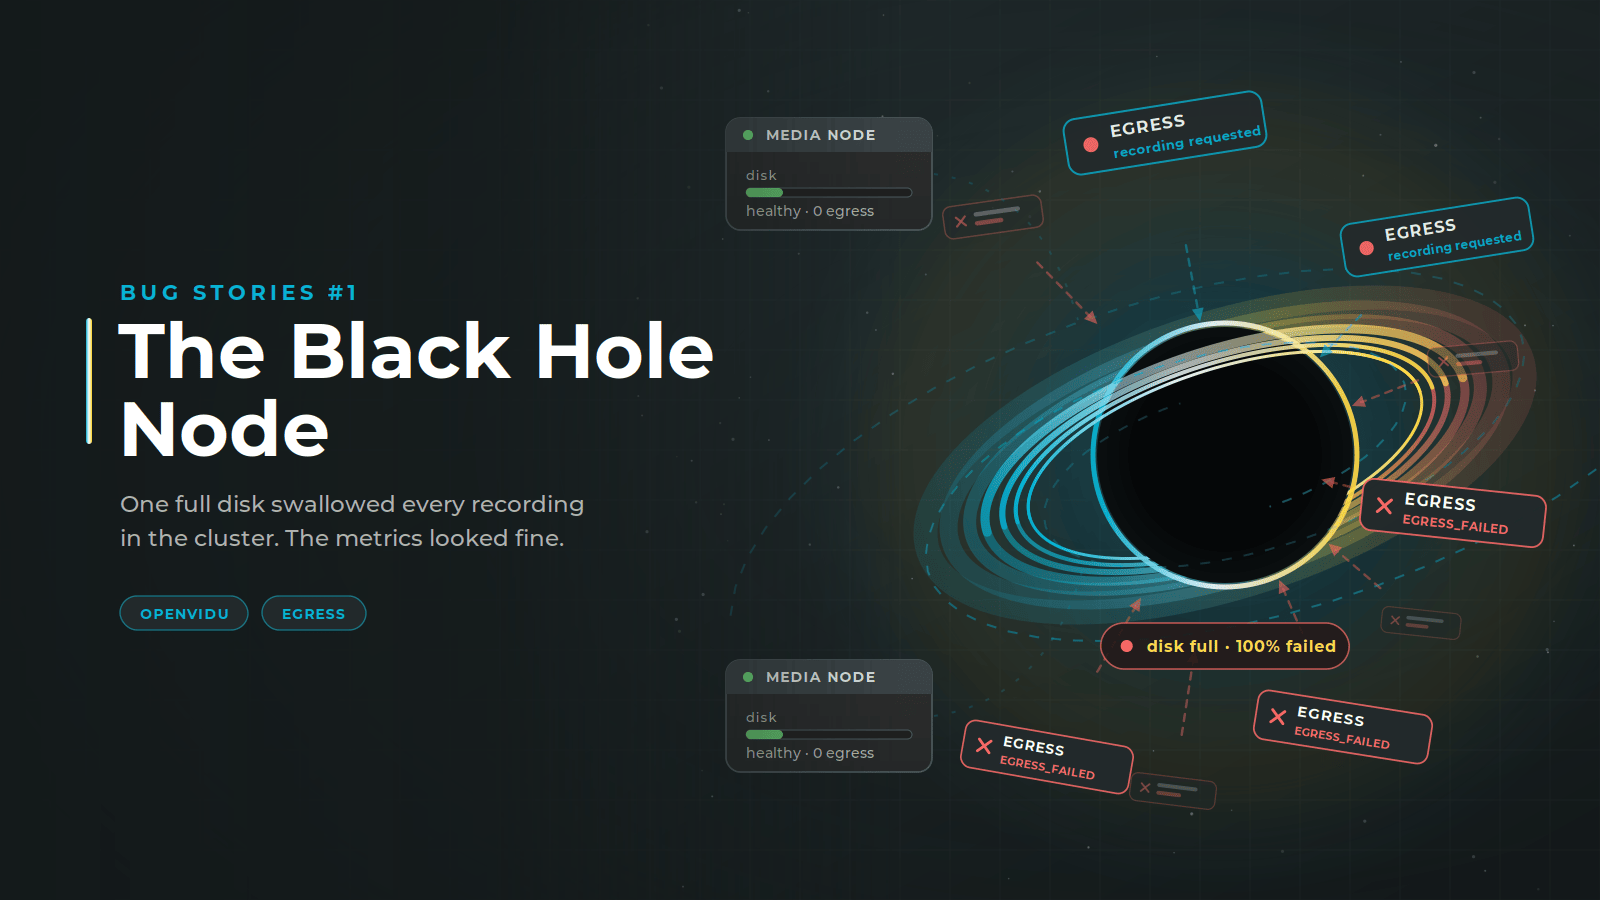
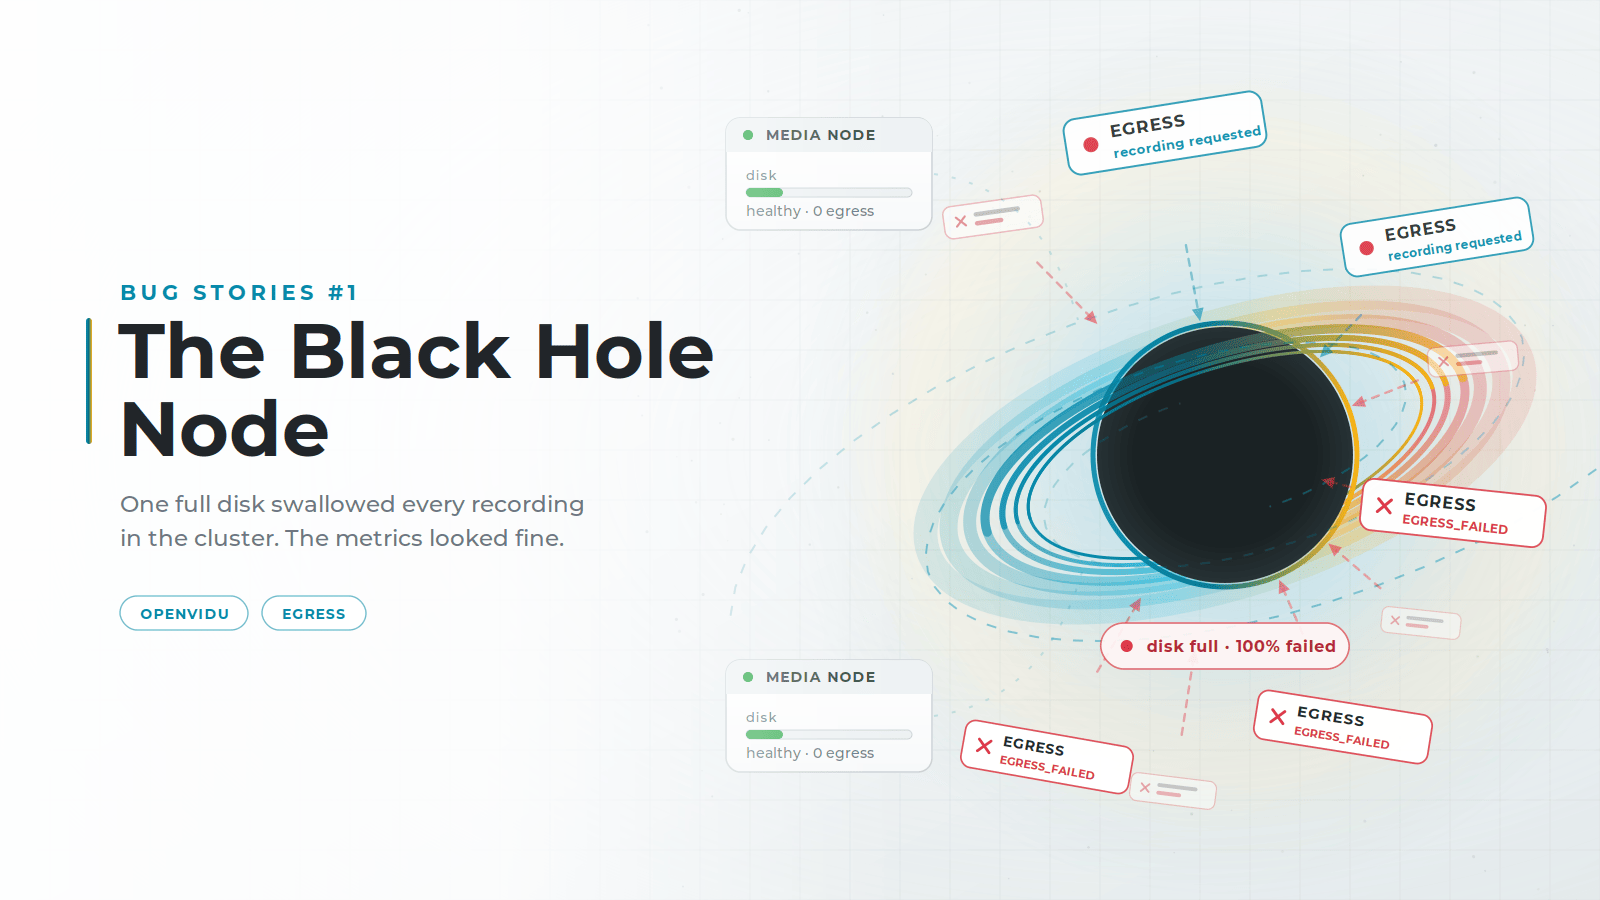
OpenVidu records media from its rooms with a service called Egress, and spreads that work across multiple Media Nodes, each one running an Egress of its own. Our Egress is built on LiveKit's, but the algorithm that decides which node takes each recording is our own implementation. LiveKit does not choose by CPU: it weights each recording by type to decide which nodes can take it at all, then hands the job to one that is already recording, picking at random when every candidate is idle. We added a CPU-aware strategy on top and made it the default, so a new recording lands on the node with the most headroom rather than on the busiest one.
We did that to keep the load even across the cluster and get more out of every Media Node. But in systems as complex as WebRTC it is easy to miss second-order effects: parts that behave perfectly on their own and break once you put them together. Our strategy broke when it met a disk limit nobody had accounted for, and it took the recording capability of a whole cluster with it.
The metrics never pointed at it. What they measure is whether a cluster is healthy, and this one was. The failure was somewhere else, in the logs, and that is where we traced it, node by node, until we found what to fix.
Recordings failing for no apparent reason#
A customer came to us with a problem in their production cluster: at a certain point, a huge share of Egress recordings (close to 100%) had begun failing. Your first instinct might be a spike in demand, but the metrics suggested otherwise: CPU usage was stable, and Media Nodes had plenty of headroom.
When CPU metrics don't indicate an overload, it's time to dig into the logs. OpenVidu deploys Grafana alongside the cluster, with container logs streamed into Loki, segmented by Media Node and service. Since the failures were specific to Egress recordings, we filtered for that service to inspect the failed attempts.
The status was identical across the board: EGRESS_FAILED, and every egress_ended webhook carried the same reason:
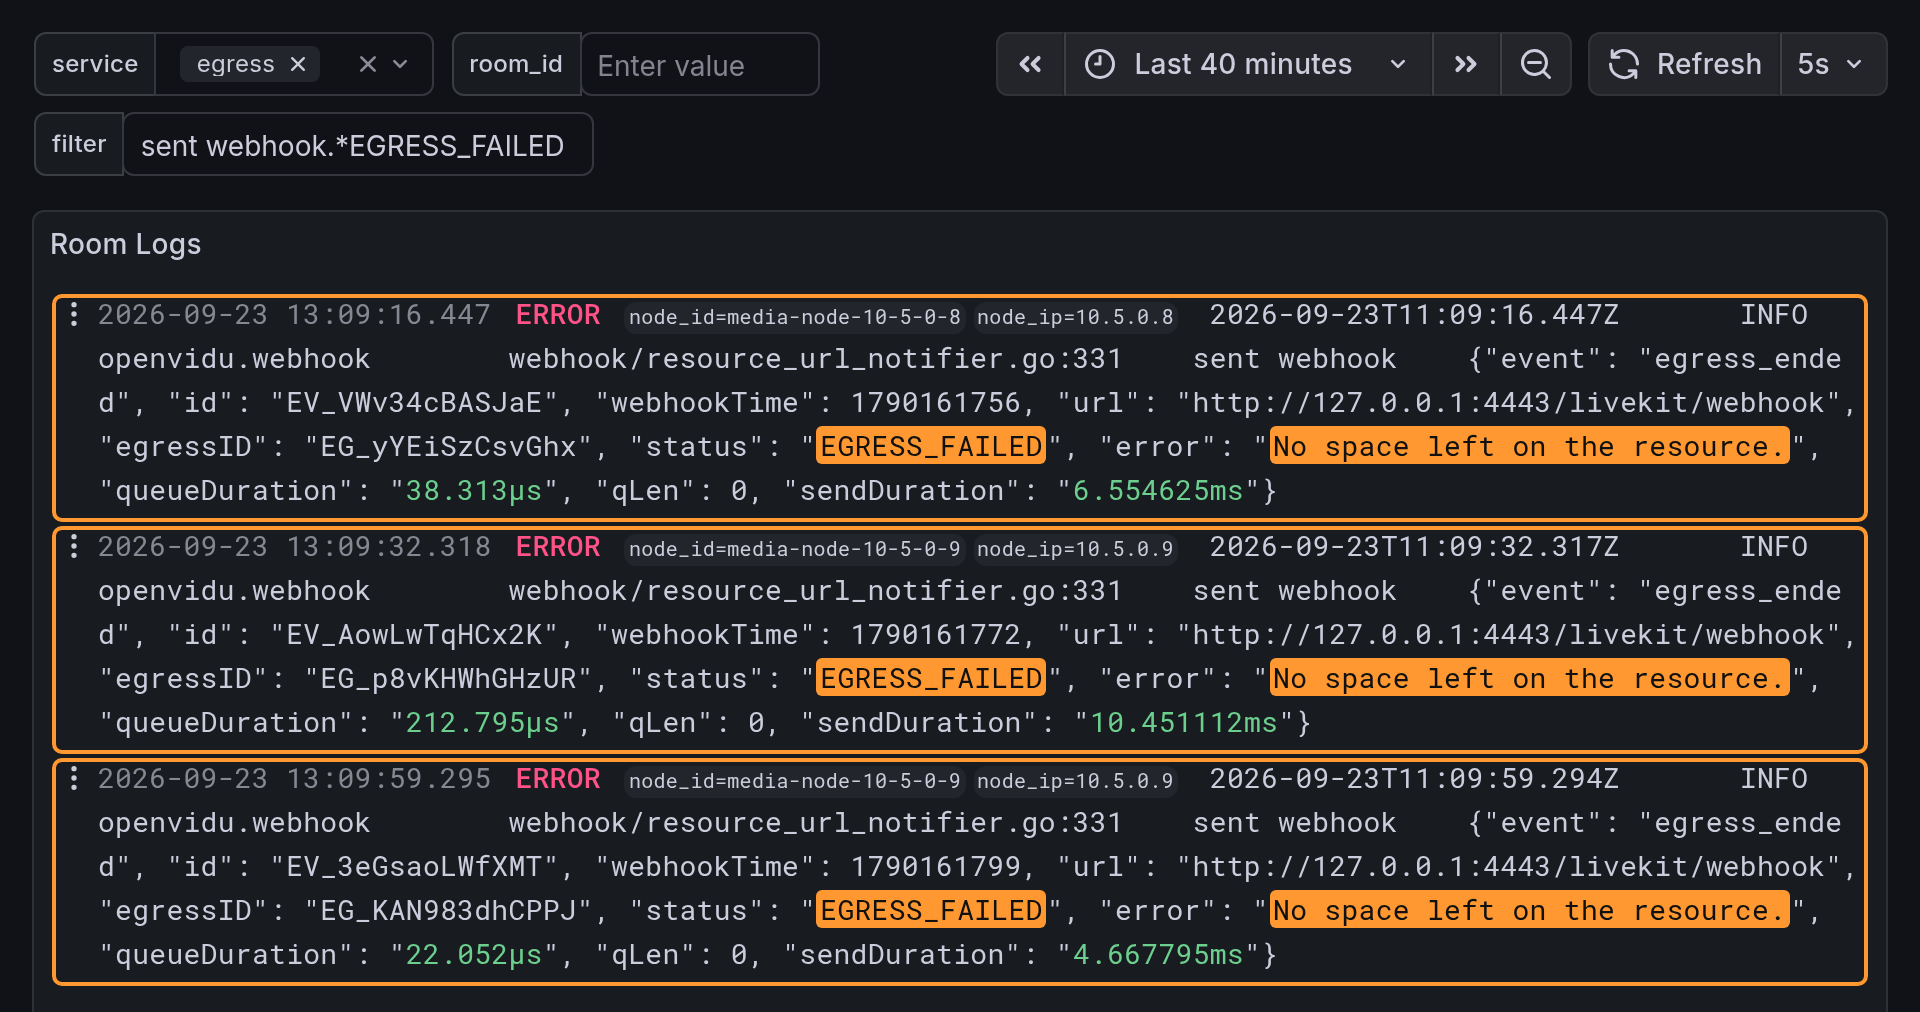
"error": "No space left on the resource.": the issue was disk space. Recordings are first written to a temporary directory before being uploaded to external storage; if that directory fills up, the write operation fails. The strange part wasn't the failure itself, but its scale: it wasn't just a few isolated recordings failing. Nearly the entire cluster was affected.
At first glance, it seemed as if all Media Nodes had run out of disk space simultaneously. However, that would be a massive coincidence. Before assuming the worst, we needed to pinpoint exactly where this was happening: in how many Media Nodes, and in which ones.
The webhook tells you that a recording failed and why, but it doesn't specify which Media Node hosted the Egress. In an OpenVidu cluster, that could be any of them. We pivoted from the Room logs to the logs of every container in the cluster, filtered for failed Egresses, and looked at the node label on each line. The results were unexpected:
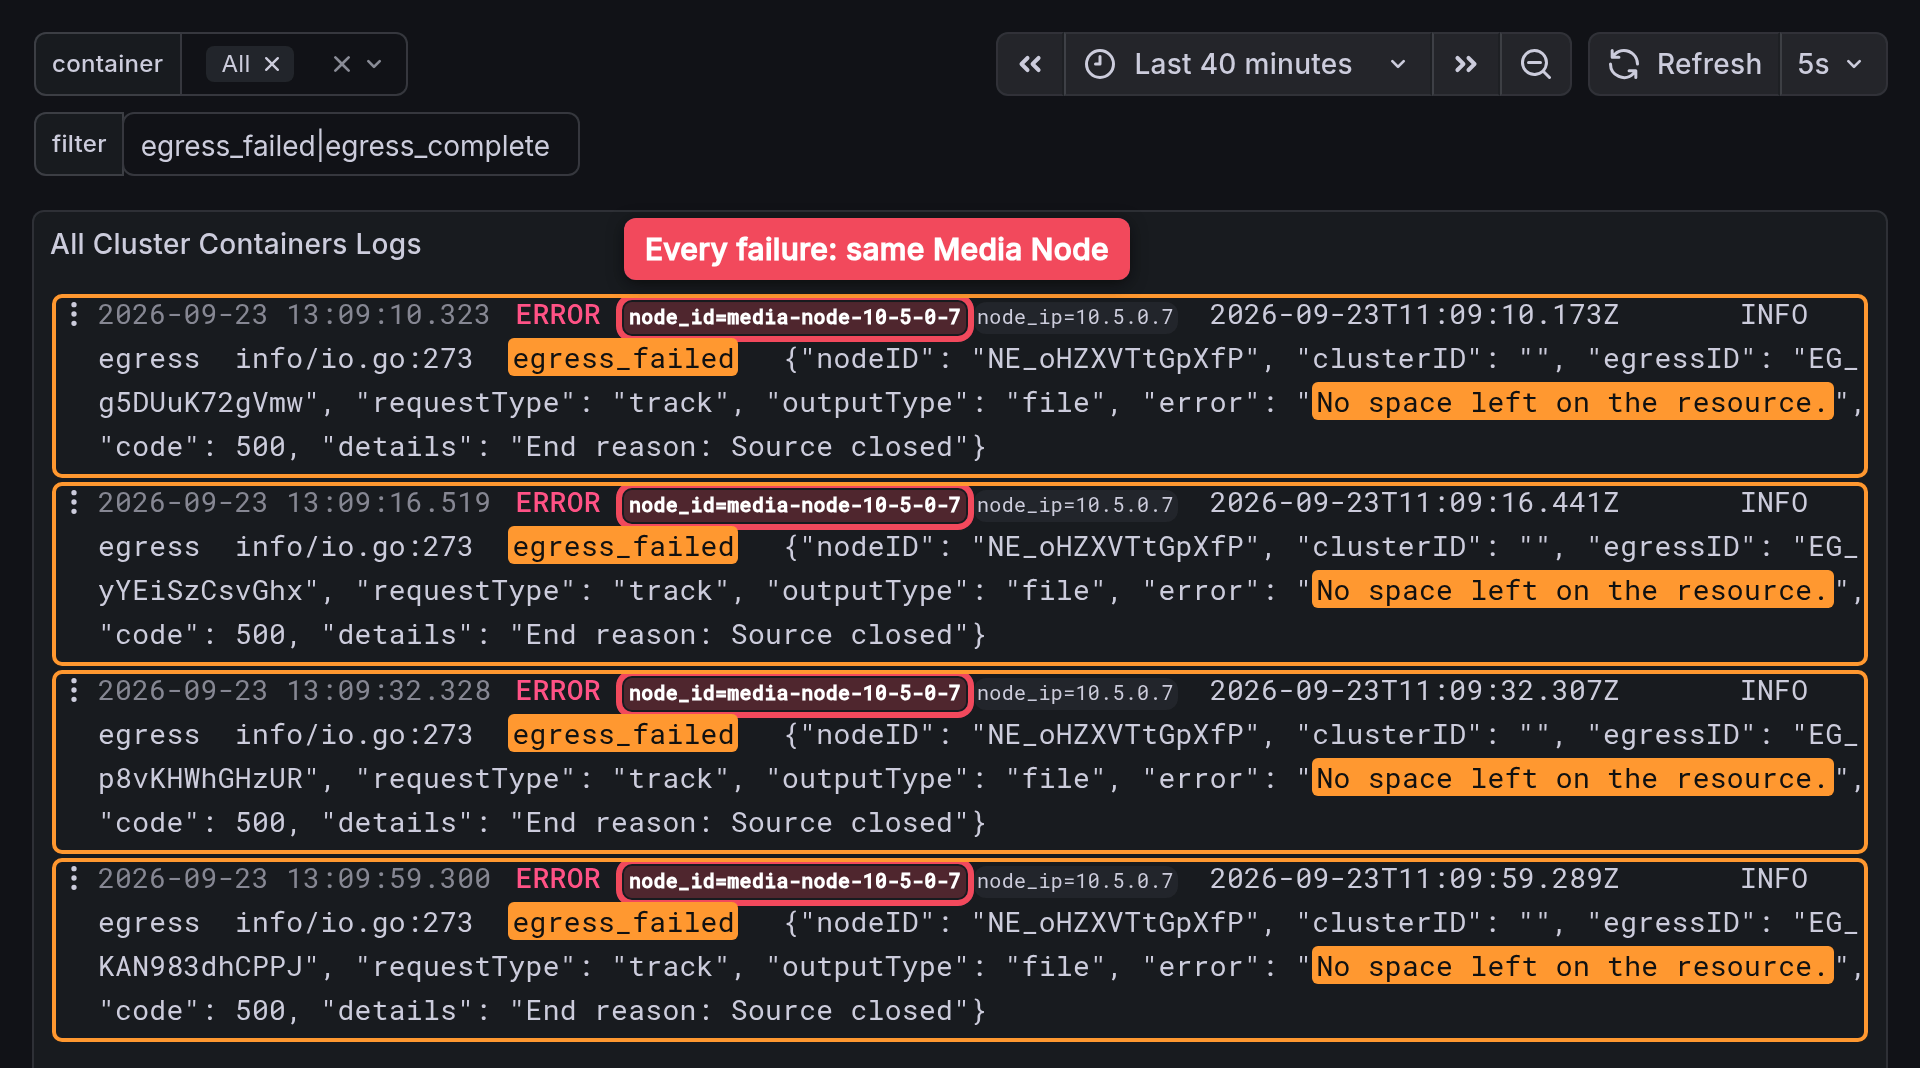
All failures originated from a single source: one Media Node with a full disk, where Egress processes repeatedly died while attempting to write to the filesystem. The rest of the Media Nodes had plenty of space, and recordings weren't even reaching the healthy ones.
In other words, it wasn't a cluster-wide issue; it was a single Media Node running out of disk, yet almost every recording in the cluster kept getting routed to it, only to fail there. This only makes sense if the placement algorithm was actively routing work to the one Media Node that couldn't record.
The root cause: the emptiest node was the broken one#
So, why would the algorithm pick that specific Media Node? This is where it gets counterintuitive.
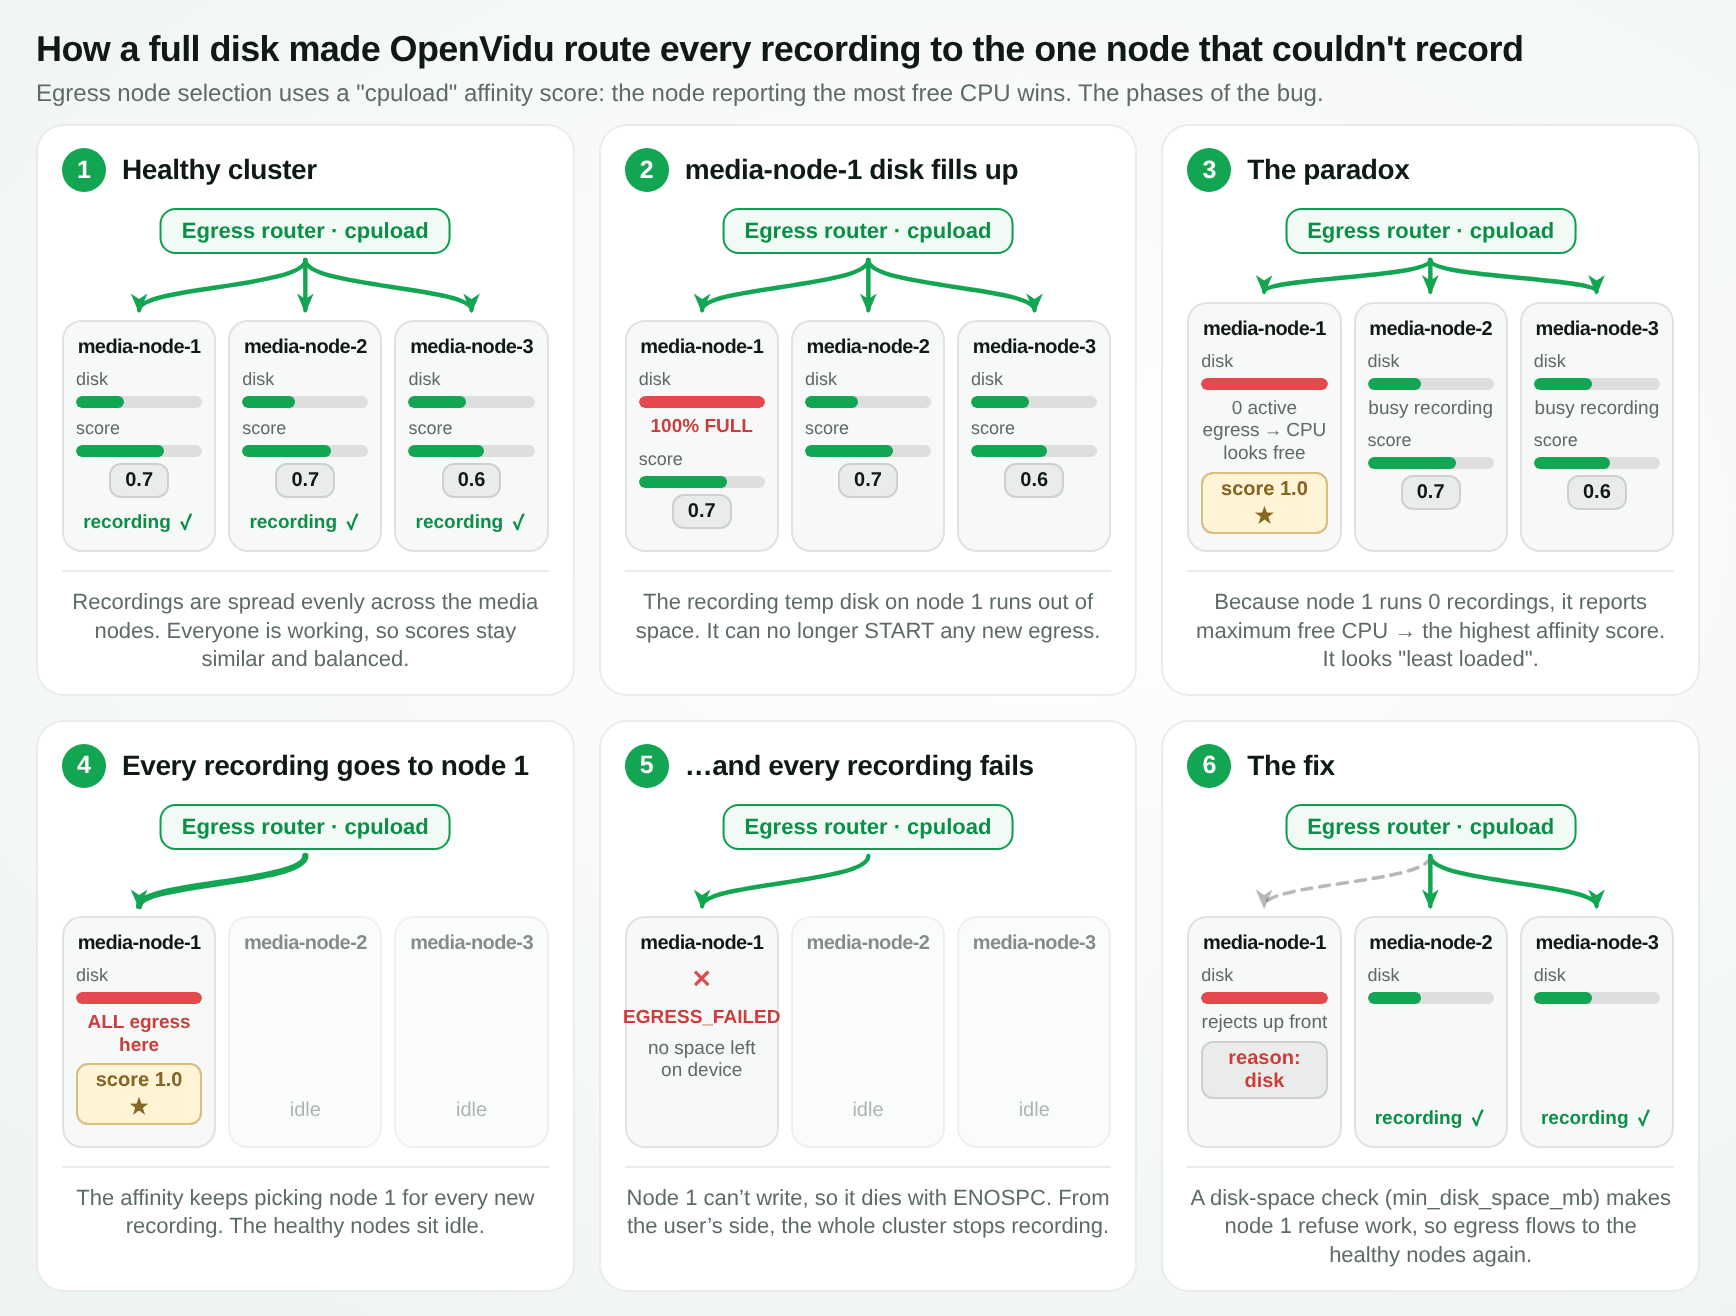
When a Track, participant, or Room needs recording, OpenVidu decides which Media Node's Egress will execute it. The default is cpuload, the CPU-aware strategy we added: each Egress instance scores itself based on its available CPU, and the request is routed to the highest scorer, which is the least loaded node. LiveKit's original behaviour is still available as binpack, which fills up nodes that are already recording before assigning work to new ones. On paper, distributing by CPU is entirely reasonable.
However, a full disk completely subverts this logic:
- The Media Node with the full disk cannot start any recording: every Egress assigned to it dies almost instantly the moment it touches the disk.
- Because it never maintains a running recording, it always reports zero active Egresses.
- A Media Node with zero active Egresses reports maximum free CPU, giving it the highest possible
cpuloadscore. - The algorithm, doing exactly what it was told, sees the Media Node as the most available and sends it the next recording. It fails, leaving the Media Node idle once more, and the cycle continues as it wins the next assignment too...
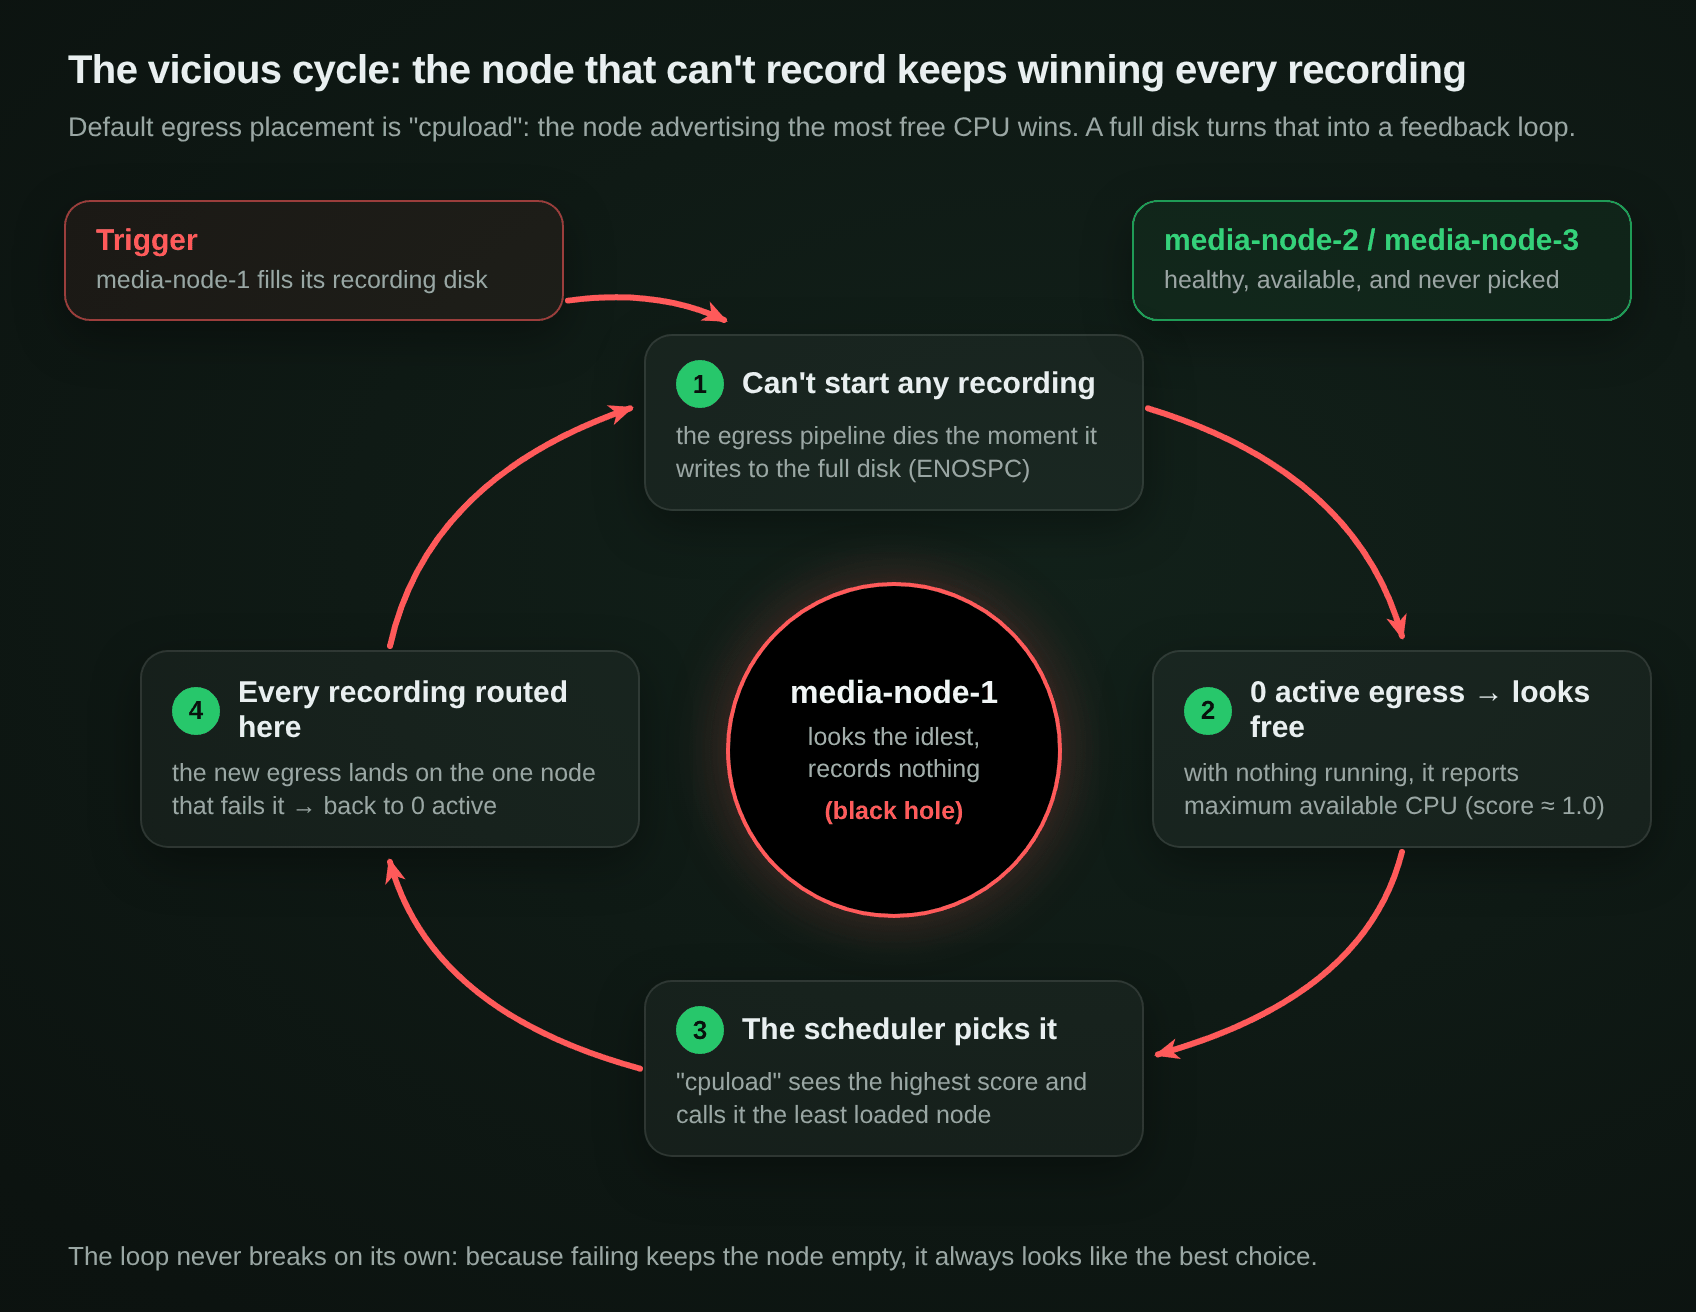
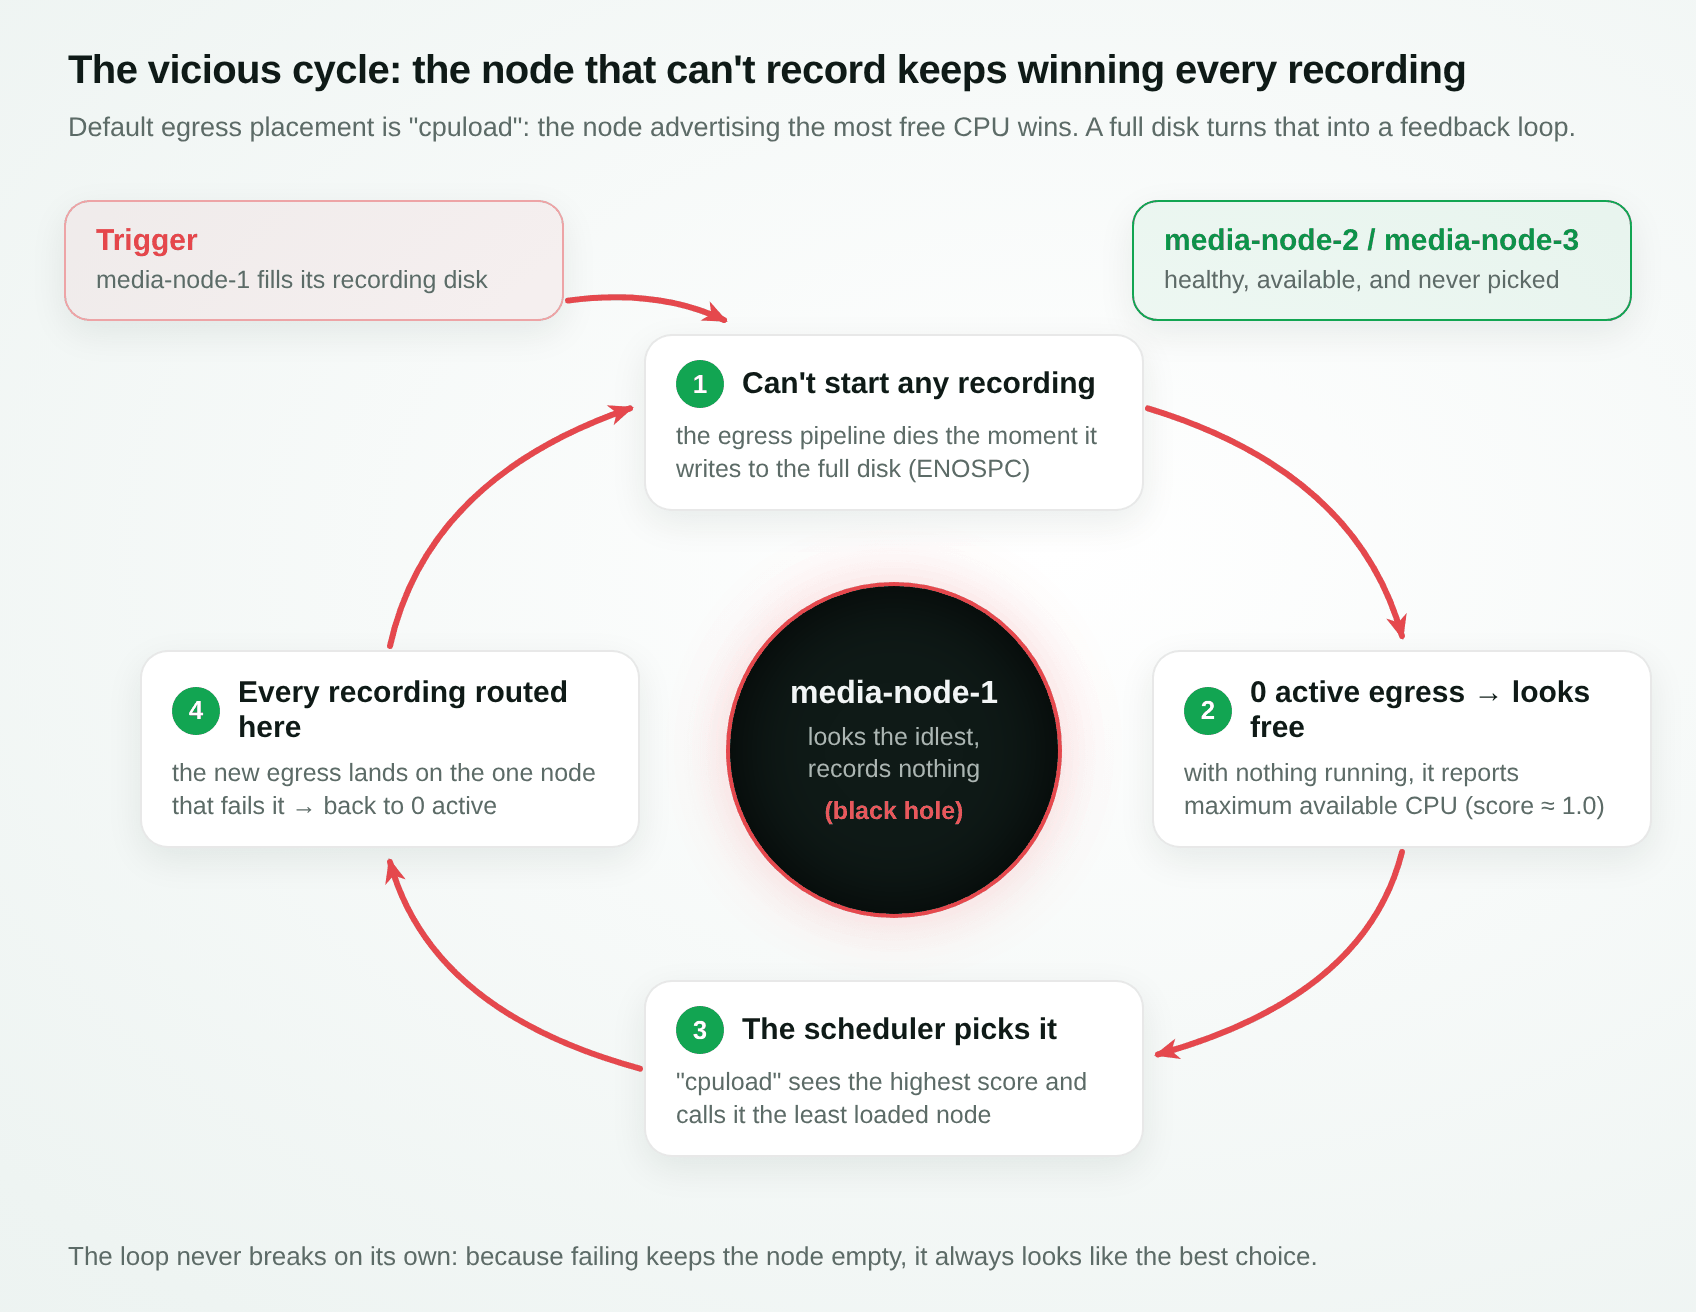
The broken Media Node had become a black hole: the more it failed, the more idle it appeared, and the more work it attracted. The healthy Media Nodes, fully capable of recording, sat there doing nothing.
The underlying problem is the signal used for load balancing. Free CPU indicates if a Media Node is idle, not if it is capable of recording. A Media Node that fails instantly consumes almost no CPU: the more broken it is, the more available it appears. By looking only at CPU, a Media Node without disk space always wins exactly when it is the worst possible candidate. We needed to make our Egress placement algorithm smarter.
The fix#
The fix addresses this directly: checking disk availability before accepting a task. The Egress monitor now checks the recording directory; if free space falls below openvidu.min_disk_space_mb in egress.yaml (512 MB by default), it rejects the request with a clear reason instead of accepting it and dying mid-pipeline. A Media Node that cannot record now steps aside instead of swallowing the work.
With the fix applied to the same cluster, and the disk still full, the affected Media Node now rejects each request and explains why, while a healthy Media Node picks up the recording:
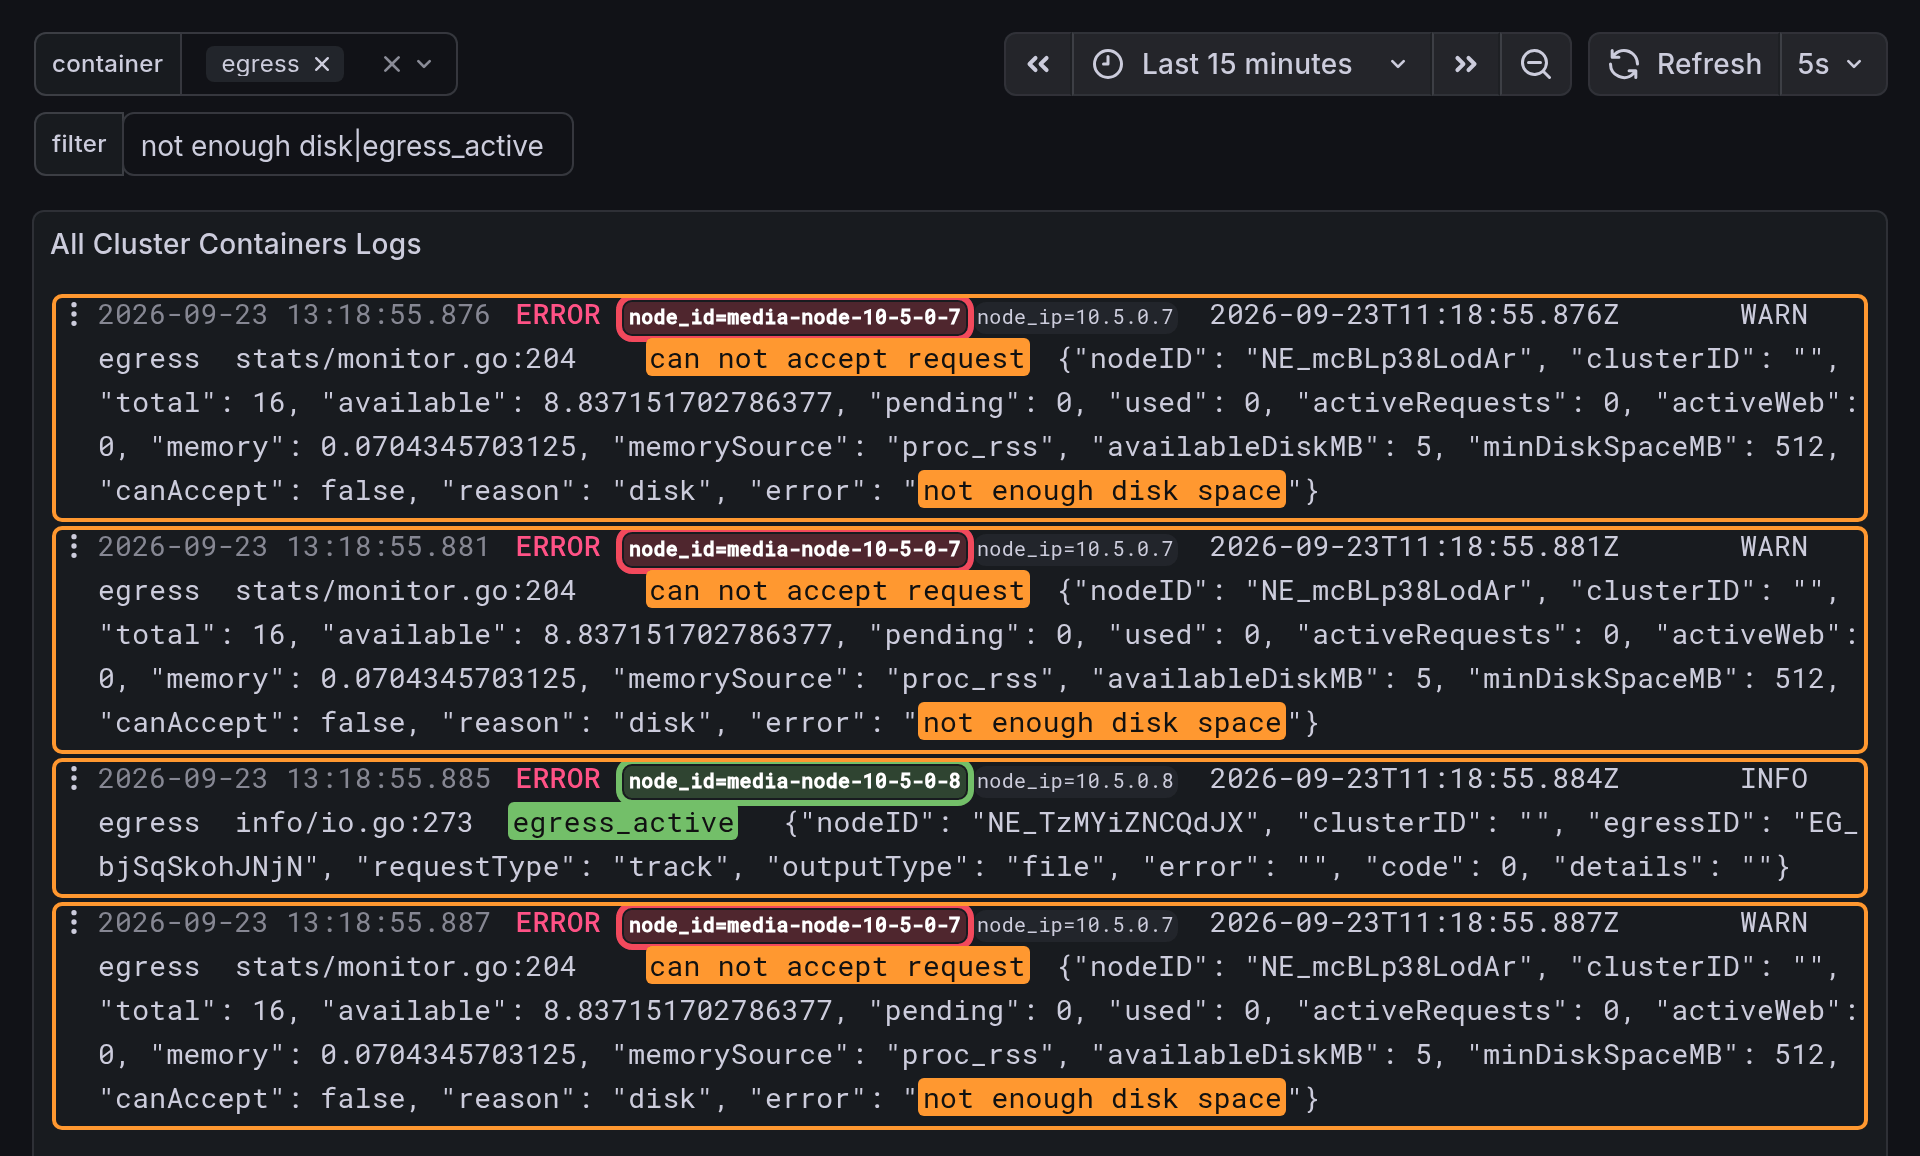
WARN egress  can not accept request
  { "total": 16, "availableDiskMB": 5, "minDiskSpaceMB": 512,
    "canAccept": false, "reason": "disk", "error": "not enough disk space" }
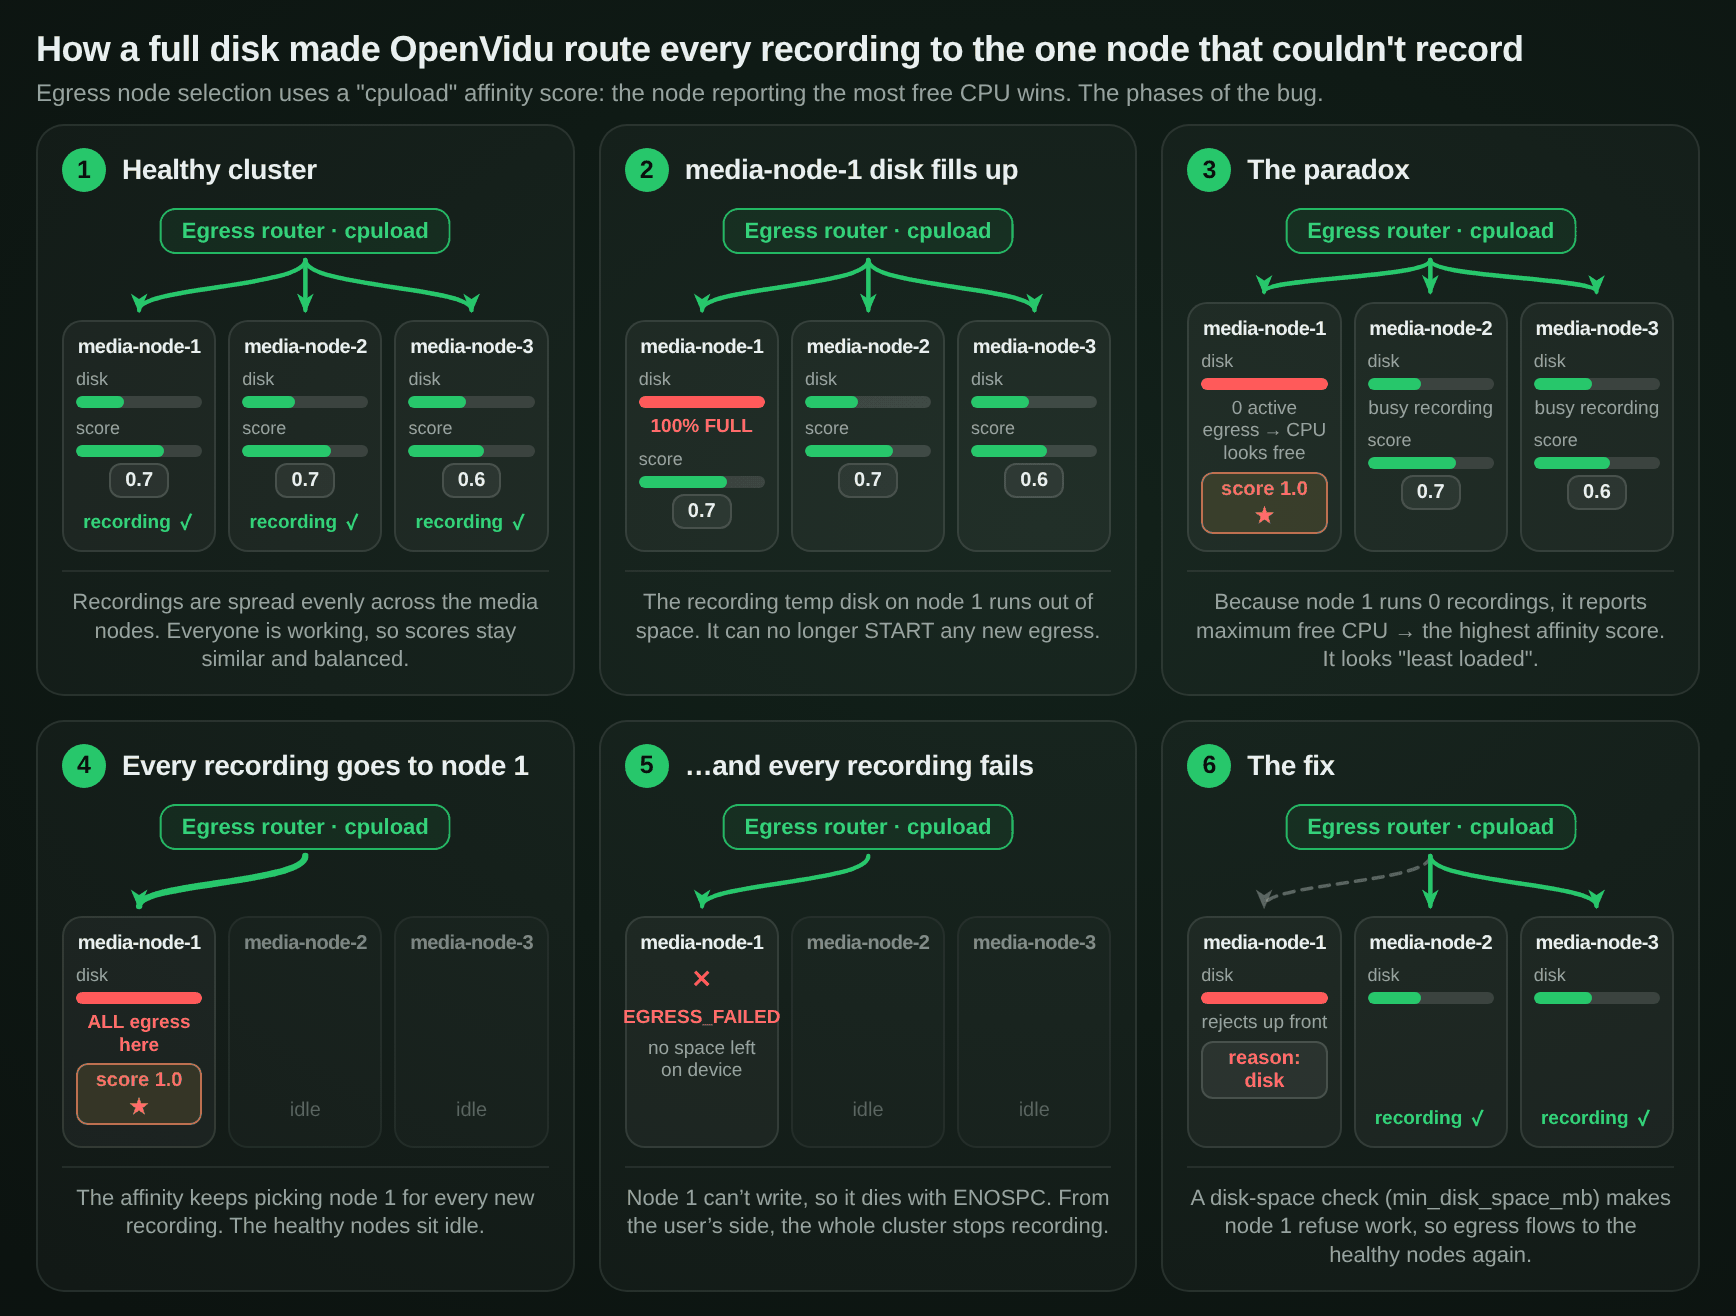
Because the full node steps aside, the algorithm routes the recordings to the healthy Media Nodes, where they complete without issue.
The following diagram illustrates the entire lifecycle: from how the bug dragged almost all recordings toward the full Media Node, to how that same Media Node behaves now with the fix in place.
Conclusions#
Two takeaways, one for each half of the story.
First: recording WebRTC involves many moving parts, and a full disk was just one of them. The real failure wasn't the disk itself, but how three components that worked fine on their own fit together: real-time recording, the temporary storage directory, and load-based distribution.
Second: data is only as good as your ability to interpret it. The metrics said the cluster was healthy and that much was true, but a healthy cluster and a working one turned out to be different things. The cause was hidden in the logs, on a single Media Node, repeating itself. This is why observability is a core part of the platform: so that when an unforeseen failure occurs, you have the tools to trace it all the way back to its source.
This bug was fixed in OpenVidu 3.6.0. If you are on that version or later, you won't run into it, and if a full upgrade is not an option right now, the fix lives entirely in the Egress service: updating the Egress version on your Media Nodes is enough to get it. We are sharing this because it is exactly the kind of second-order failure you learn the most from: invisible in metrics, capable of taking down an entire cluster's recording capability, and only revealing itself when you know where to look.
And if you are not running OpenVidu yet, all of this comes with it: every deployment ships with the Dashboard and the Grafana stack we used to trace this bug, from the very first node. Deploy OpenVidu to get the same tooling on your own cluster.
Learn more#
- Observability in OpenVidu: the Dashboard and Grafana stack every deployment ships with, and the logs and metrics we followed to trace this.
- Debugging WebRTC with an AI agent and Grafana MCP: the same Grafana stack, handed to an AI agent that traces each root cause on its own.
- How Egress is balanced across Media Nodes: the
cpuloadandbinpackallocation strategies, and the eligibility check every new Egress request goes through, disk space included. - Troubleshooting recordings: recordings that fail or return a 503, including the no disk space free case behind this story.