Grafana Stack#
OpenVidu also provides different Grafana dashboards to monitor metrics from OpenVidu Server and logs from your cluster.
Grafana is available at https://your.domain/grafana/ and can be accessed using your Grafana admin credentials.
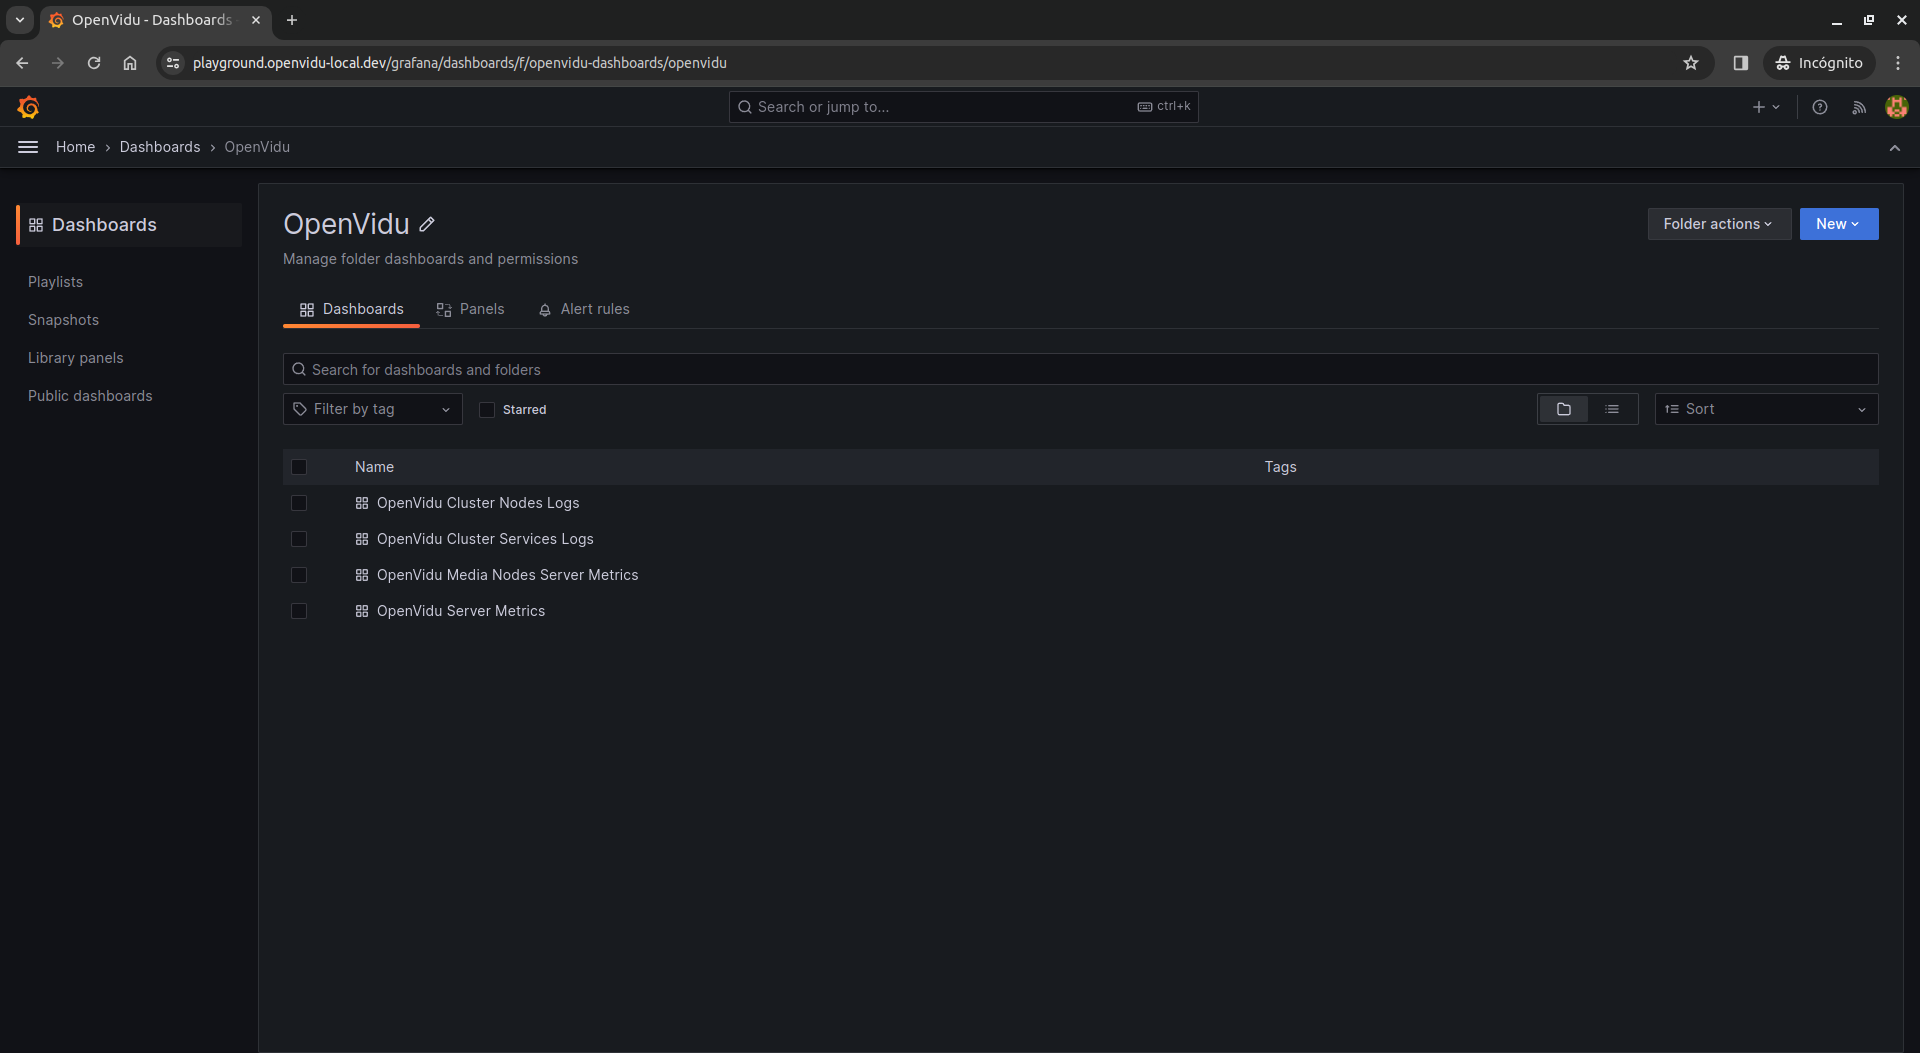
Dashboards can be found in the OpenVidu folder at https://your.domain/grafana/dashboards/f/openvidu-dashboards/openvidu.
Services#
The Grafana stack that comes with OpenVidu is composed of the following services:
- Grafana : Tool for querying, visualizing, alerting on and exploring metrics, logs and traces. It queries different data sources to show data in beautiful dashboards. In OpenVidu, contains all dashboards built from Mimir/Prometheus and Loki data sources to monitor OpenVidu Server and logs from your cluster.
- Prometheus : System monitoring and alerting toolkit. It collects and stores metrics from different targets as time series data. In OpenVidu, it collects metrics from OpenVidu Server of each Media Node and sends them to Mimir.
- Mimir: Grafana software project that provides multi-tenant, long-term storage for Prometheus metrics. In OpenVidu, it is used to store metrics collected by Prometheus.
- Promtail: Agent that ships the contents of local logs to a Loki instance. In OpenVidu, it is used to collect logs from all services in your cluster and send them to Loki.
- Loki: Horizontally-scalable, highly-available, multi-tenant log aggregation system inspired by Prometheus. In OpenVidu, it is used to store logs collected by Promtail.
Dashboards#
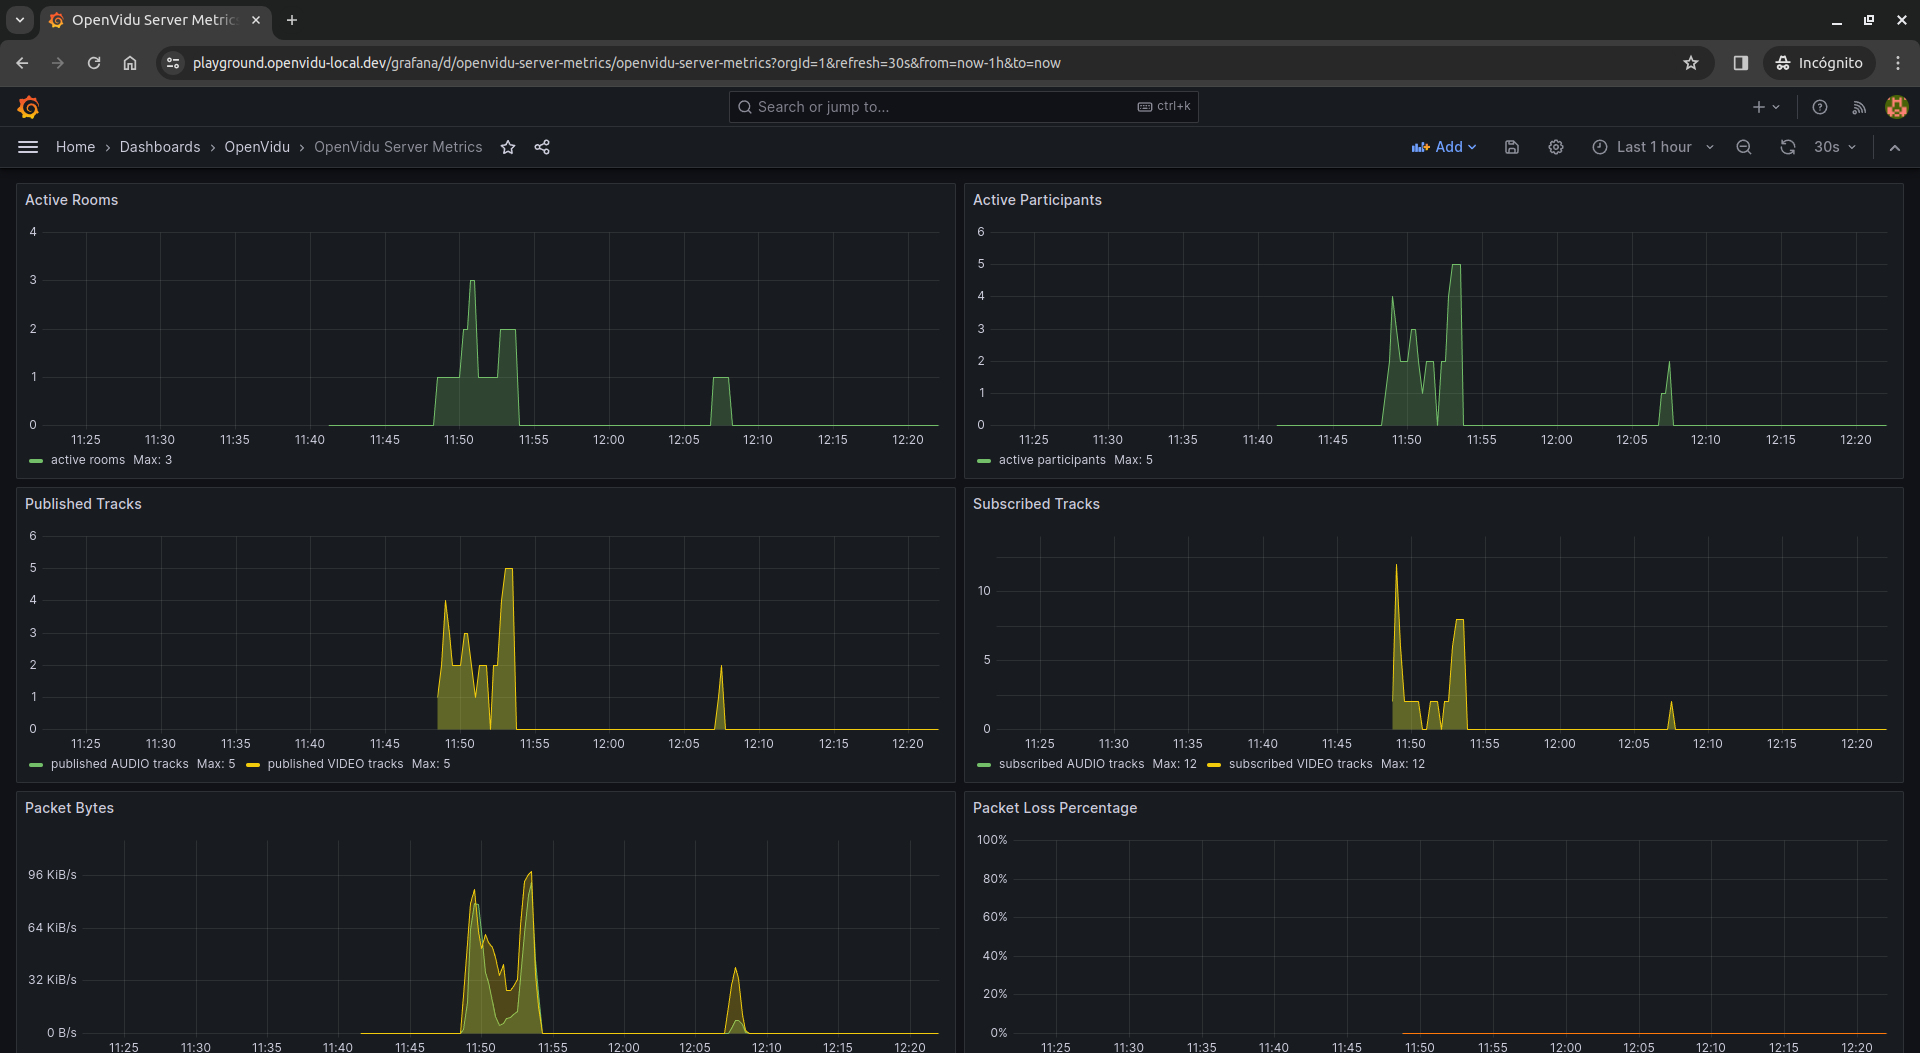
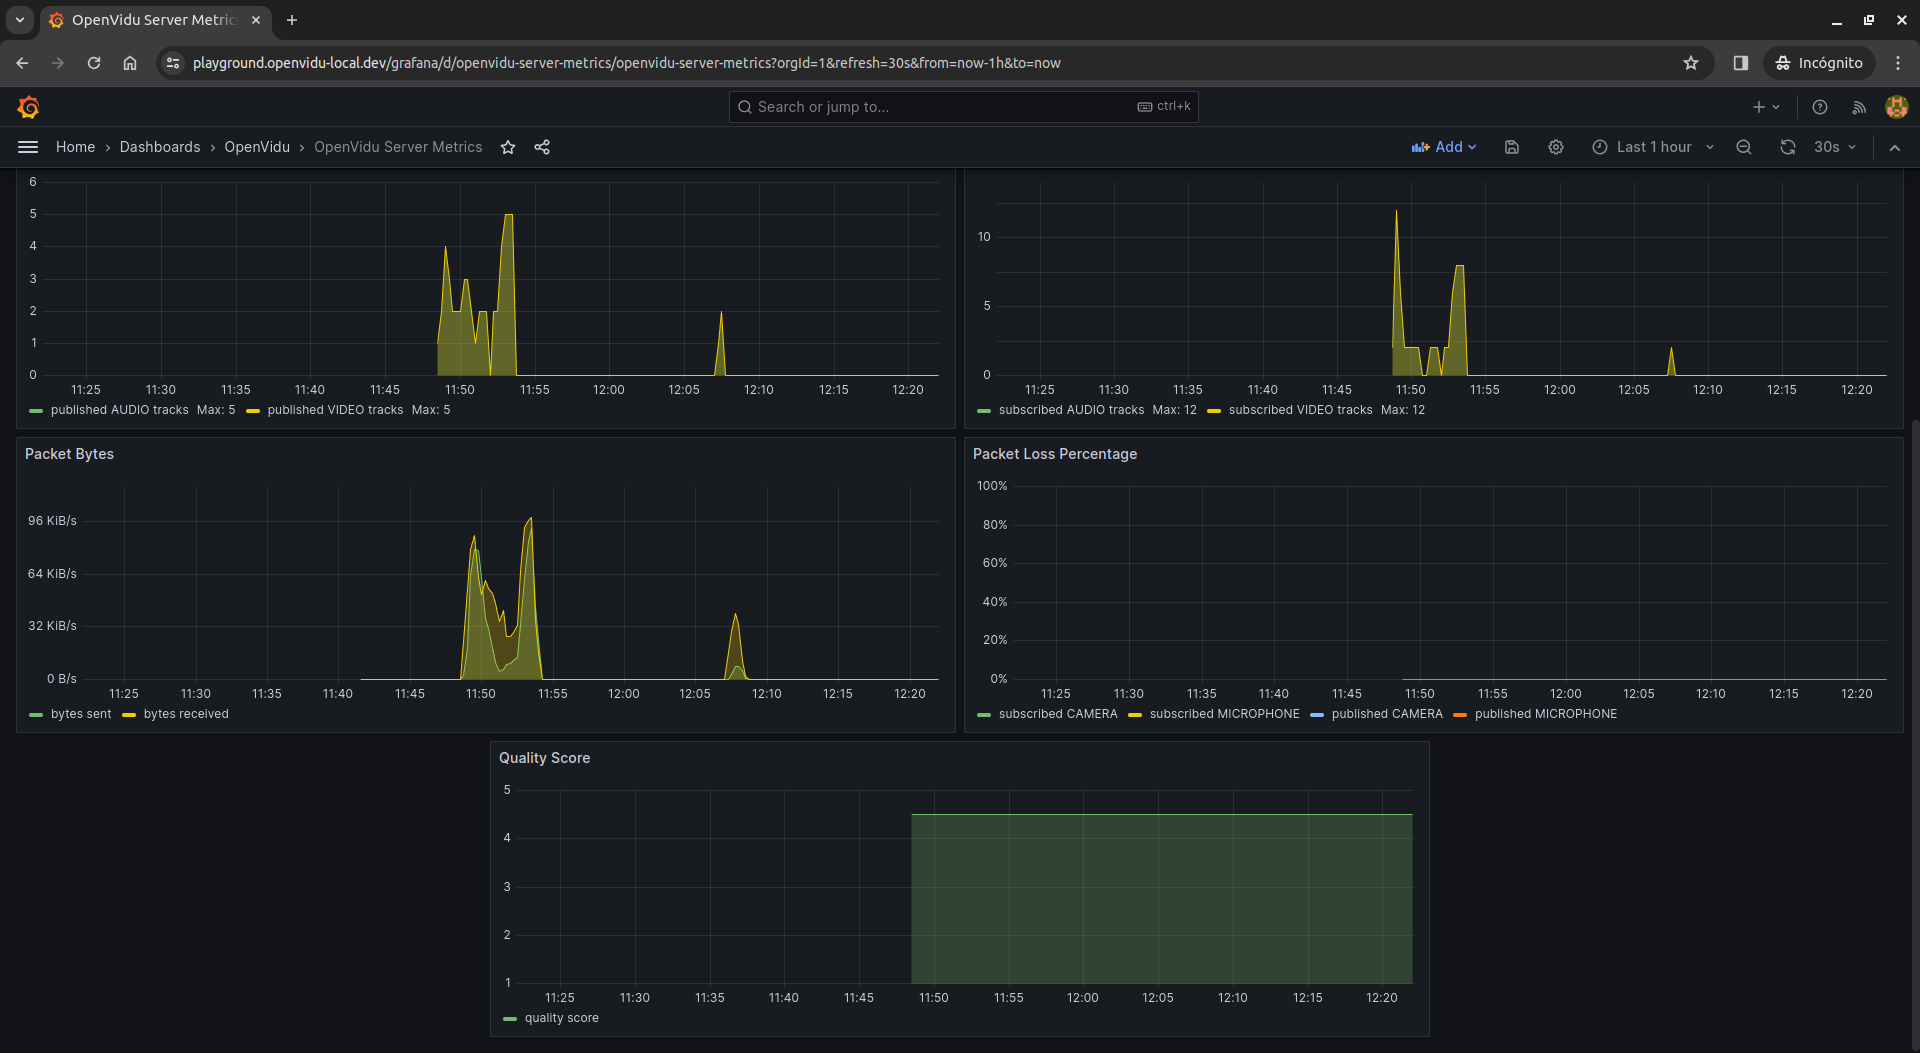
OpenVidu Server Metrics#
This dashboard provides metrics about OpenVidu Server. It includes charts about active rooms, active participants, published tracks, subscribed tracks, send/receive bytes, packet loss percentage and quality score.
In case you are using OpenVidu PRO and you have more than one Media Node deployed, you will see all metrics from all nodes combined in the same chart.
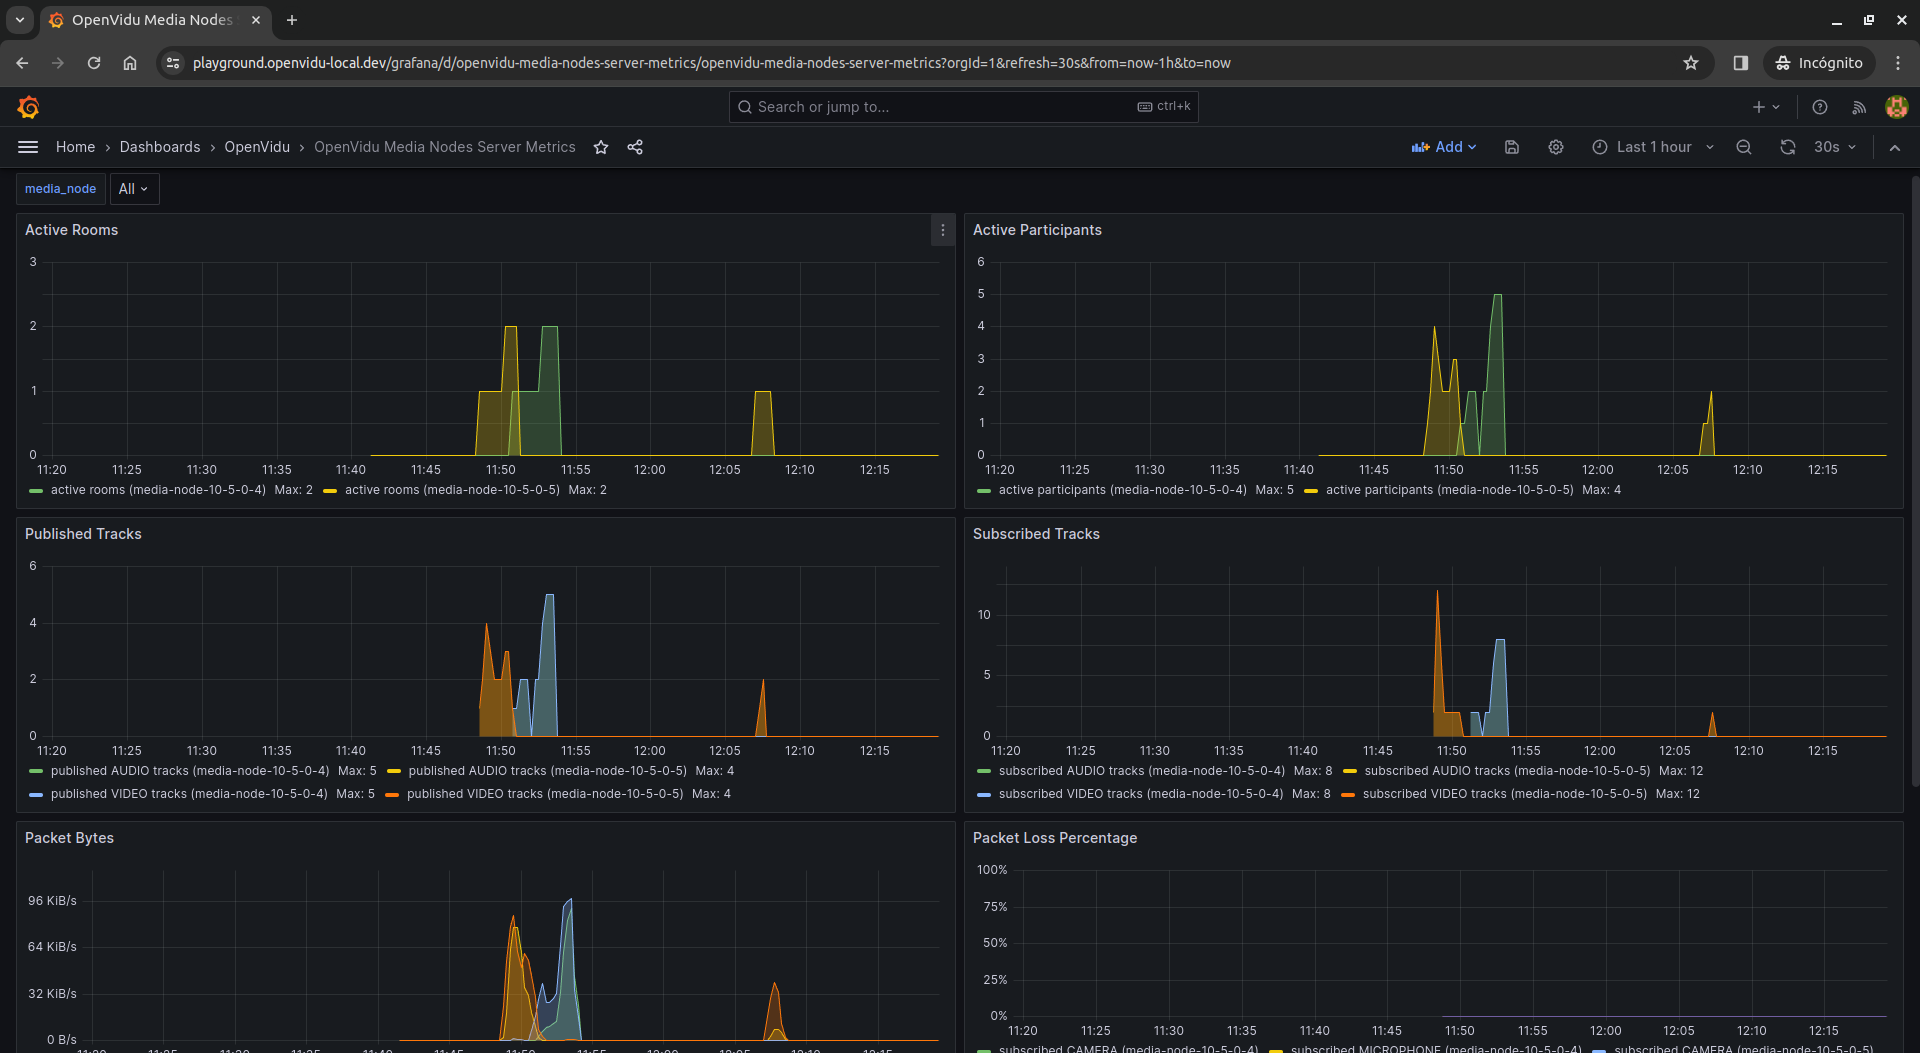
OpenVidu Media Nodes Server Metrics#
This dashboard is part of OpenVidu PRO edition.
This dashboard provides the same metrics as the OpenVidu Server Metrics dashboard, but grouped by Media Node.
You can select the Media Node you want to see metrics from in the media_node dropdown. You will see different charts in the same panel according to the selected Media Nodes.
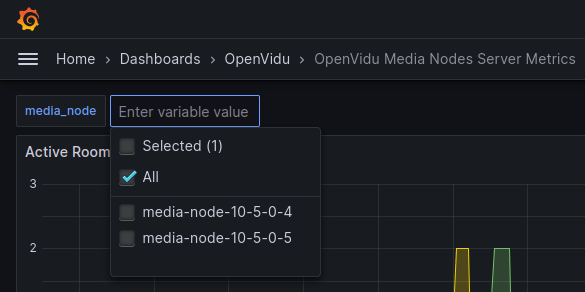
Info
If you add new Media Nodes to your OpenVidu deployment, you will have to refresh the page in order to see the new Media Nodes in the dropdown.
OpenVidu Logs#
In case you are using OpenVidu COMMUNITY, this dashboard provides different visualizations for logs from your OpenVidu Single Node deployment.
There is a panel showing all containers logs,
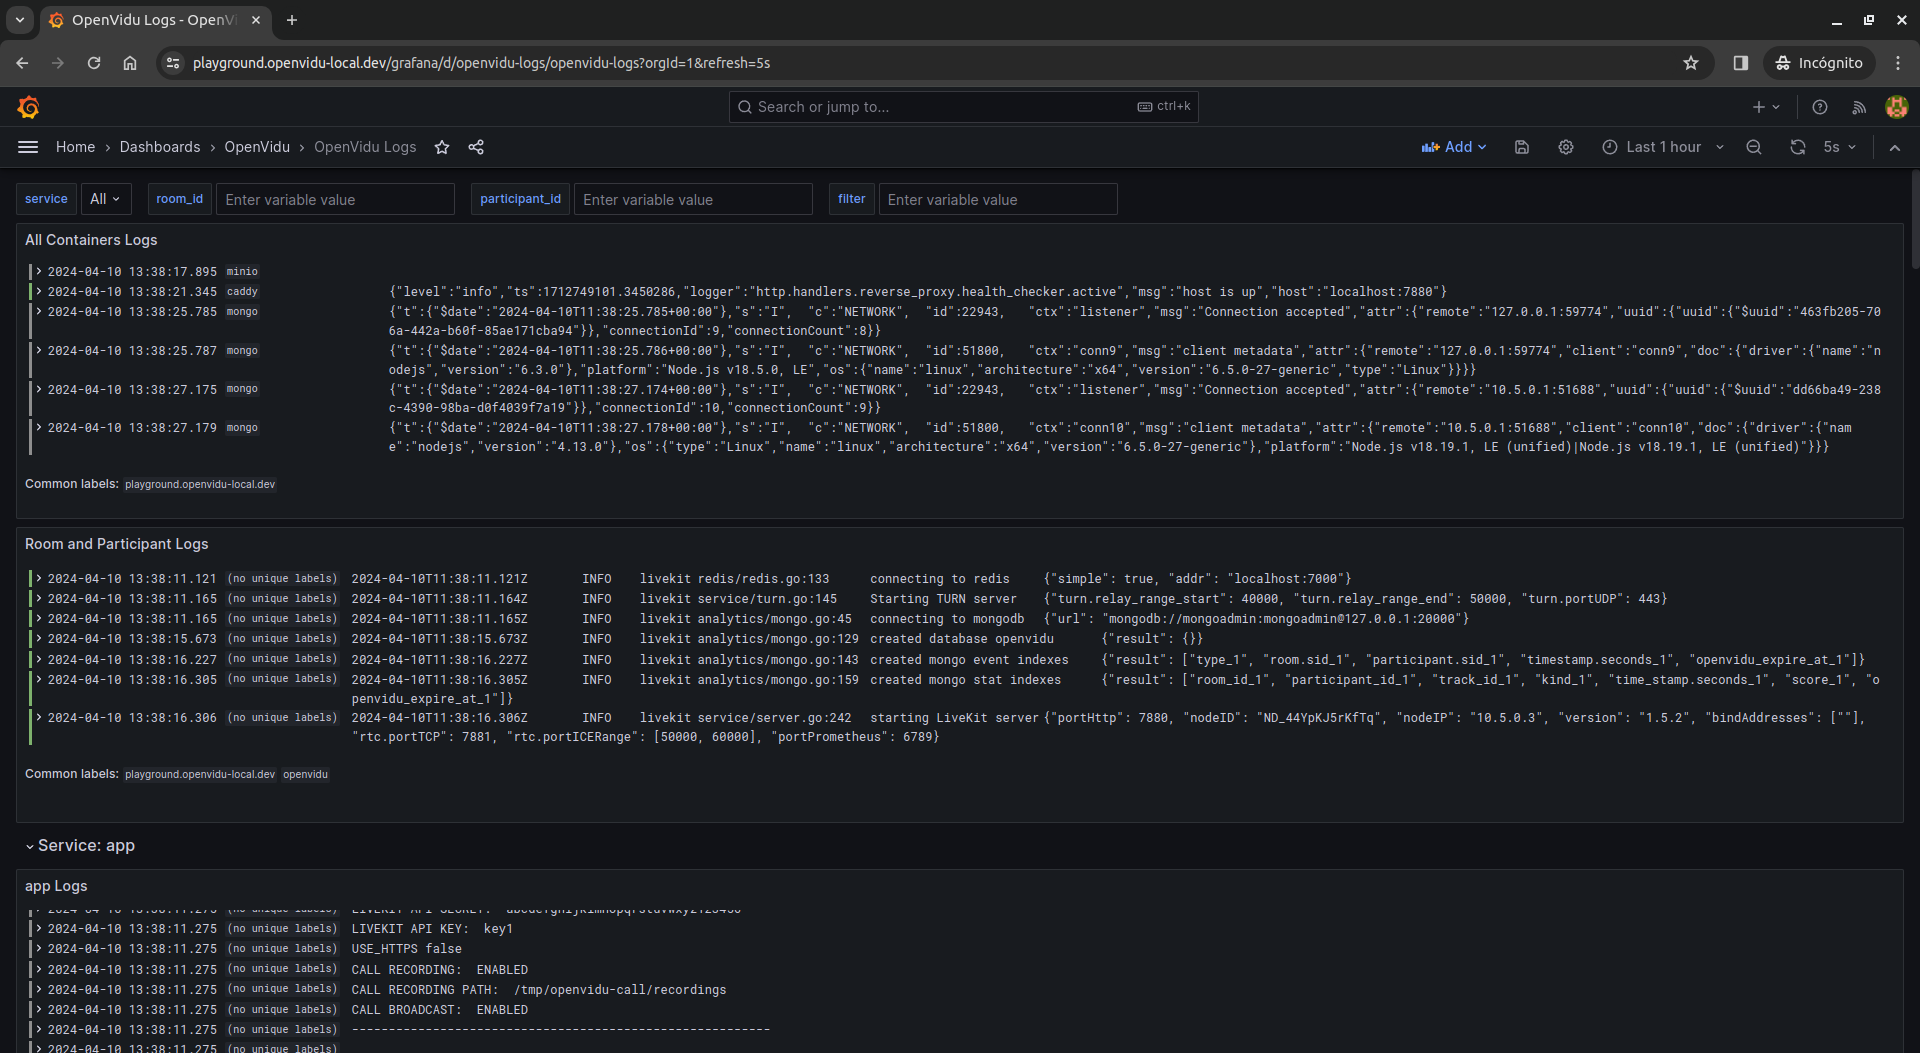
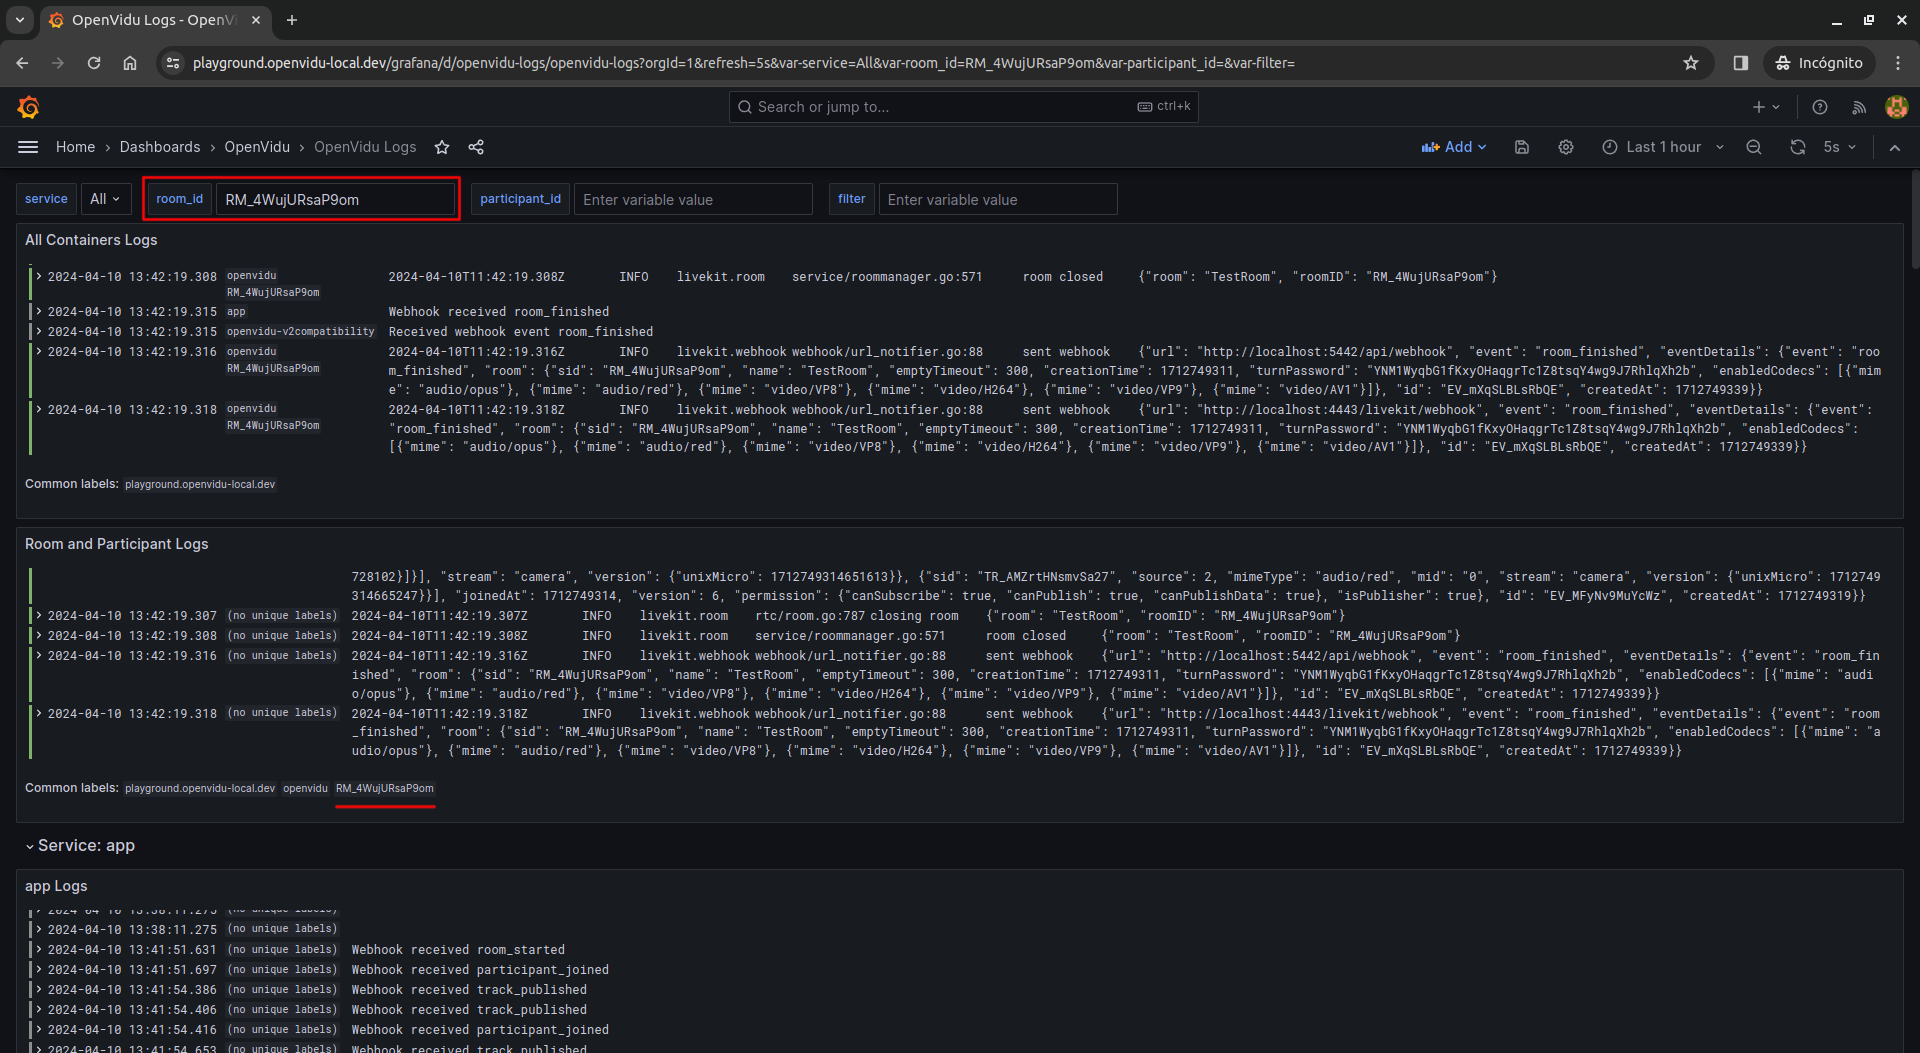
another panel to filter logs by room_id and participant_id,
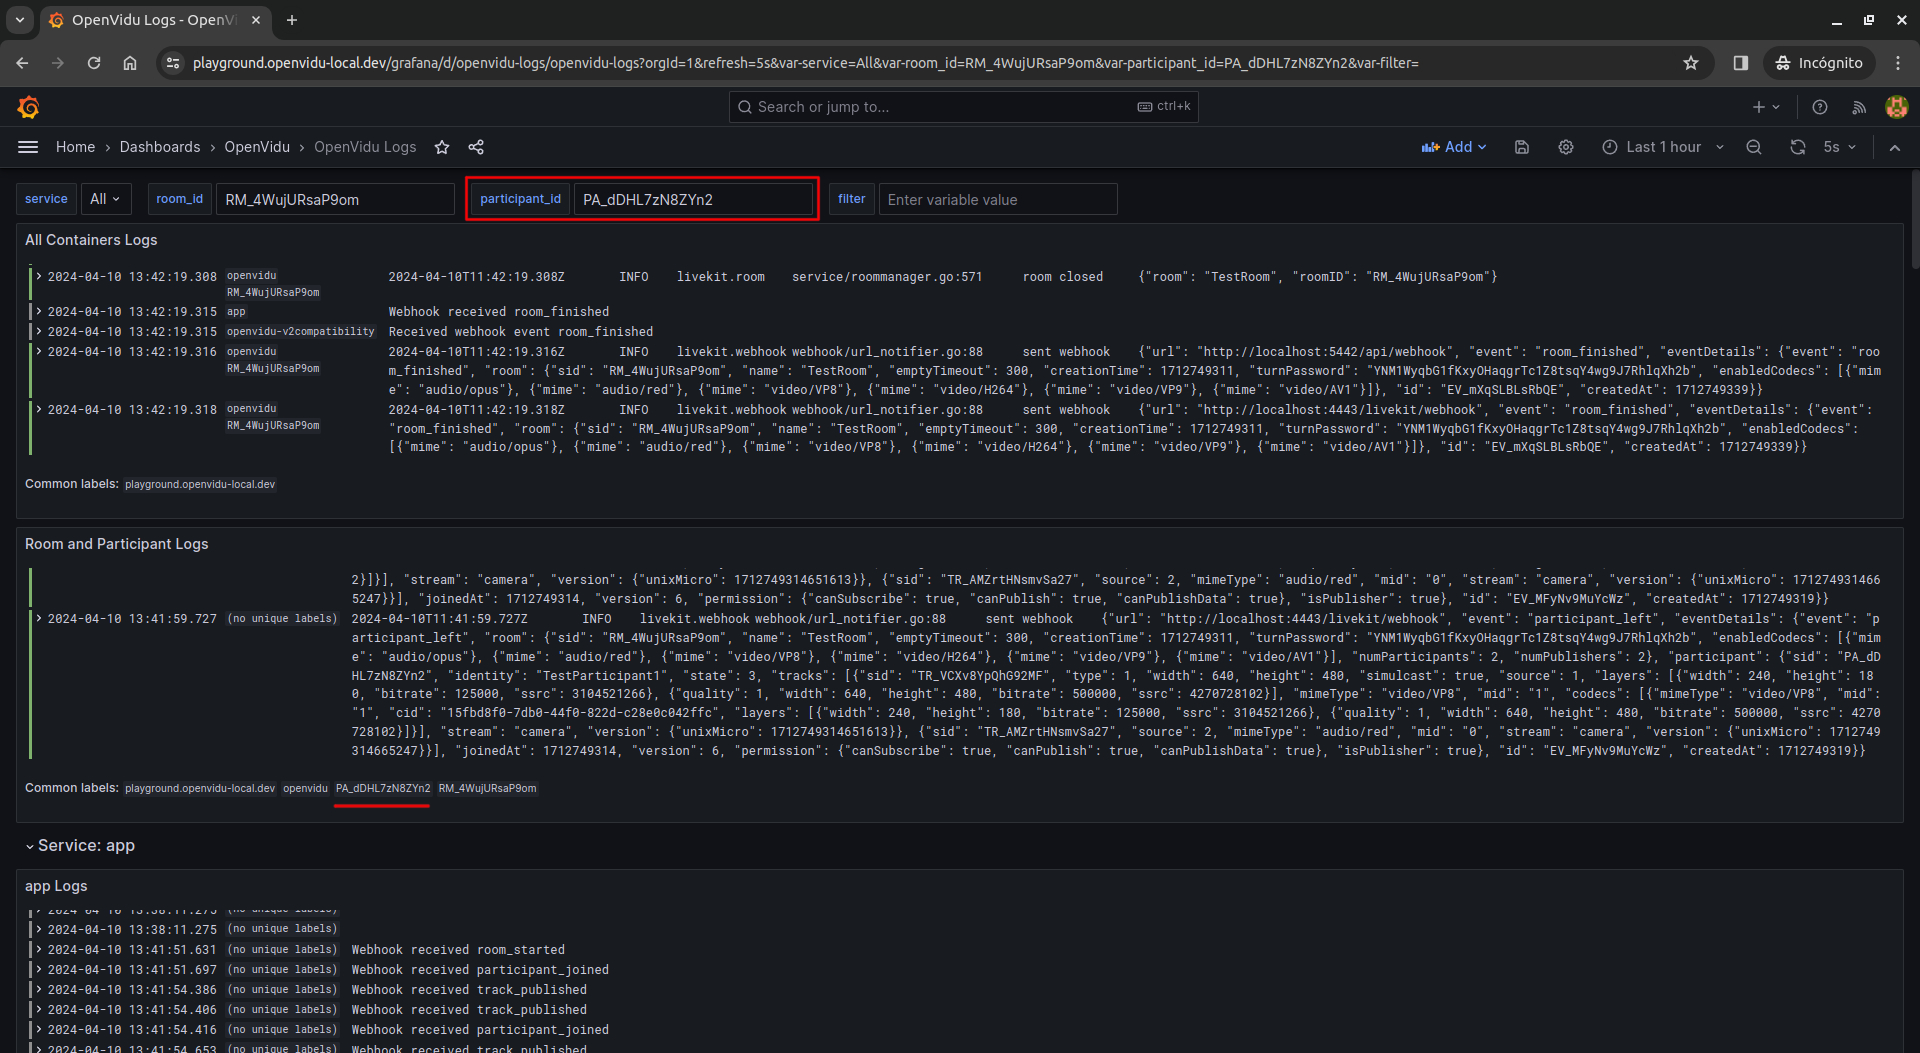
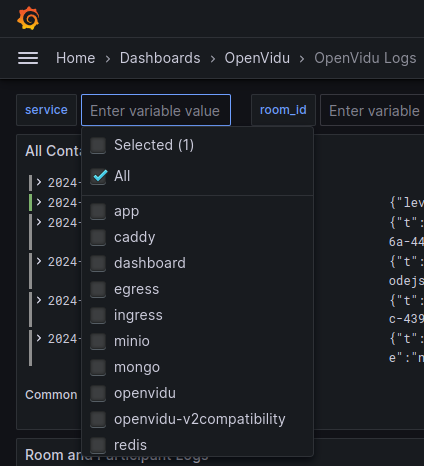
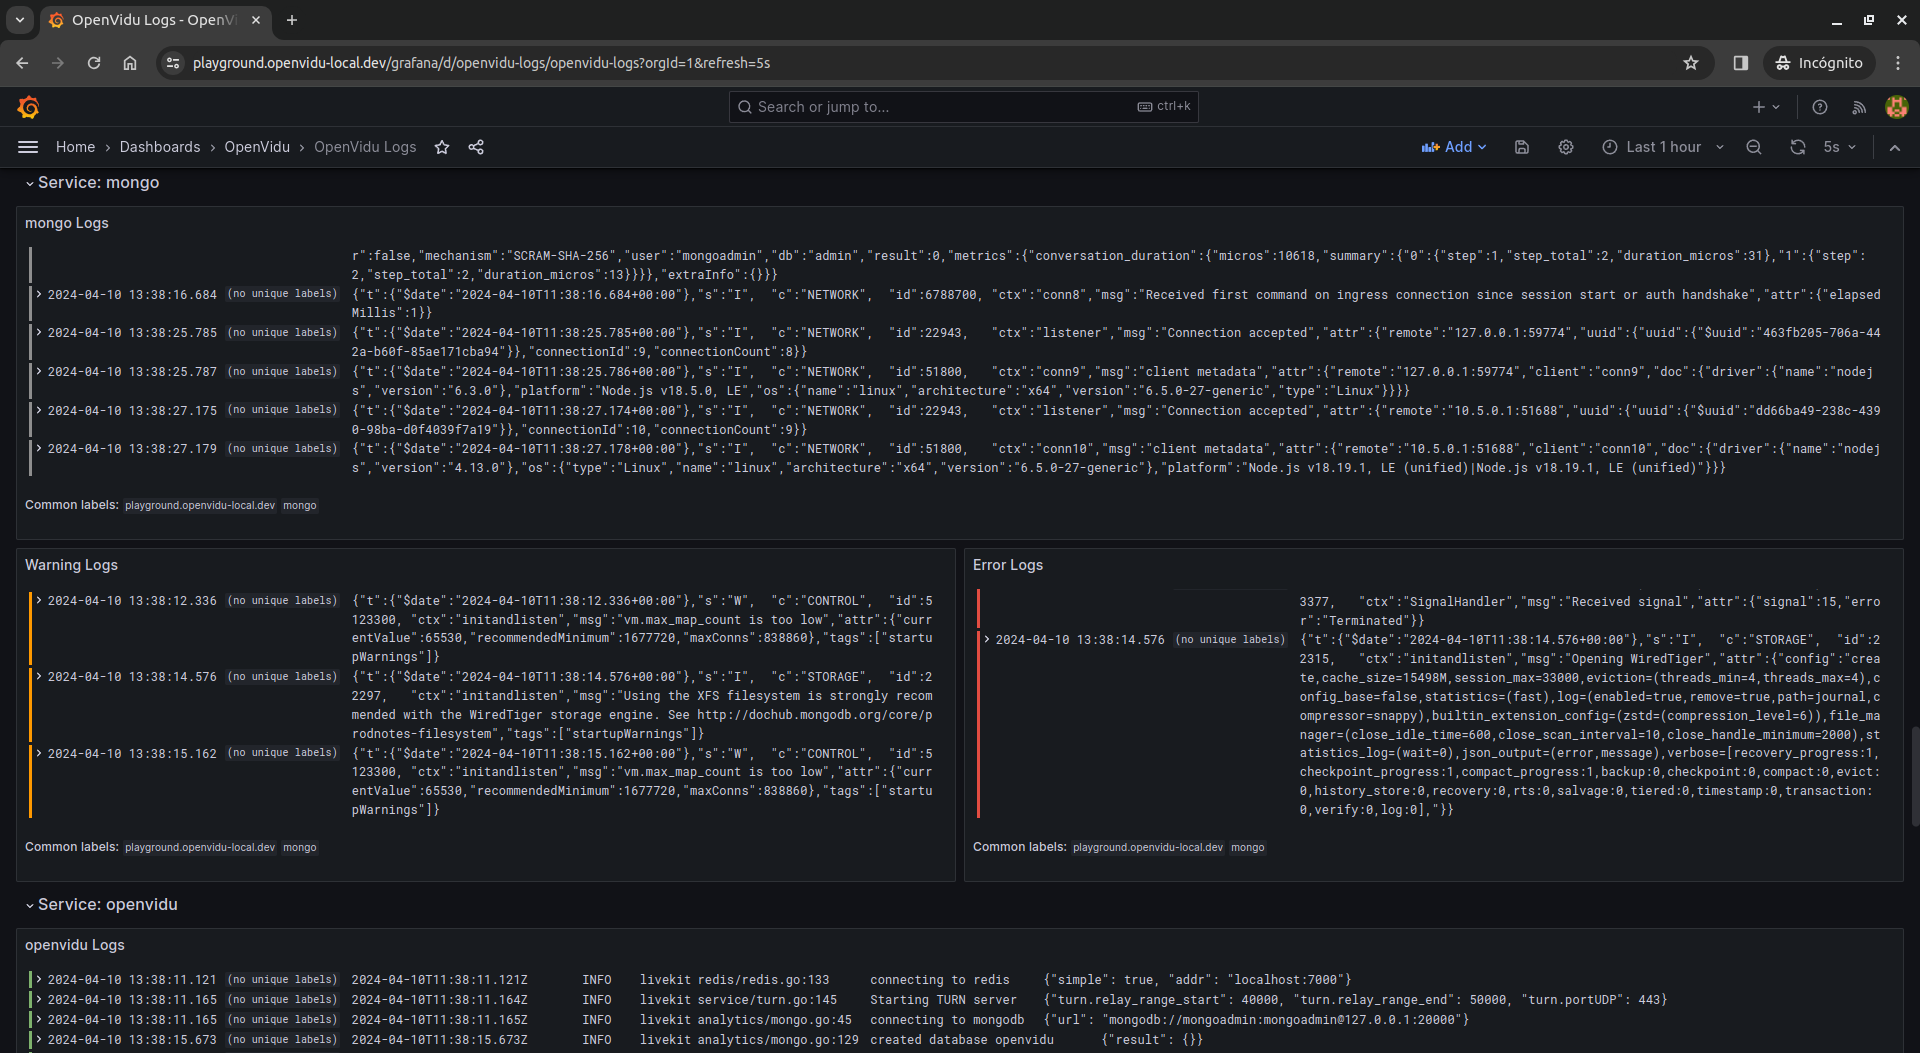
and one row for each selected service, containing all logs, warnings and errors from that service.
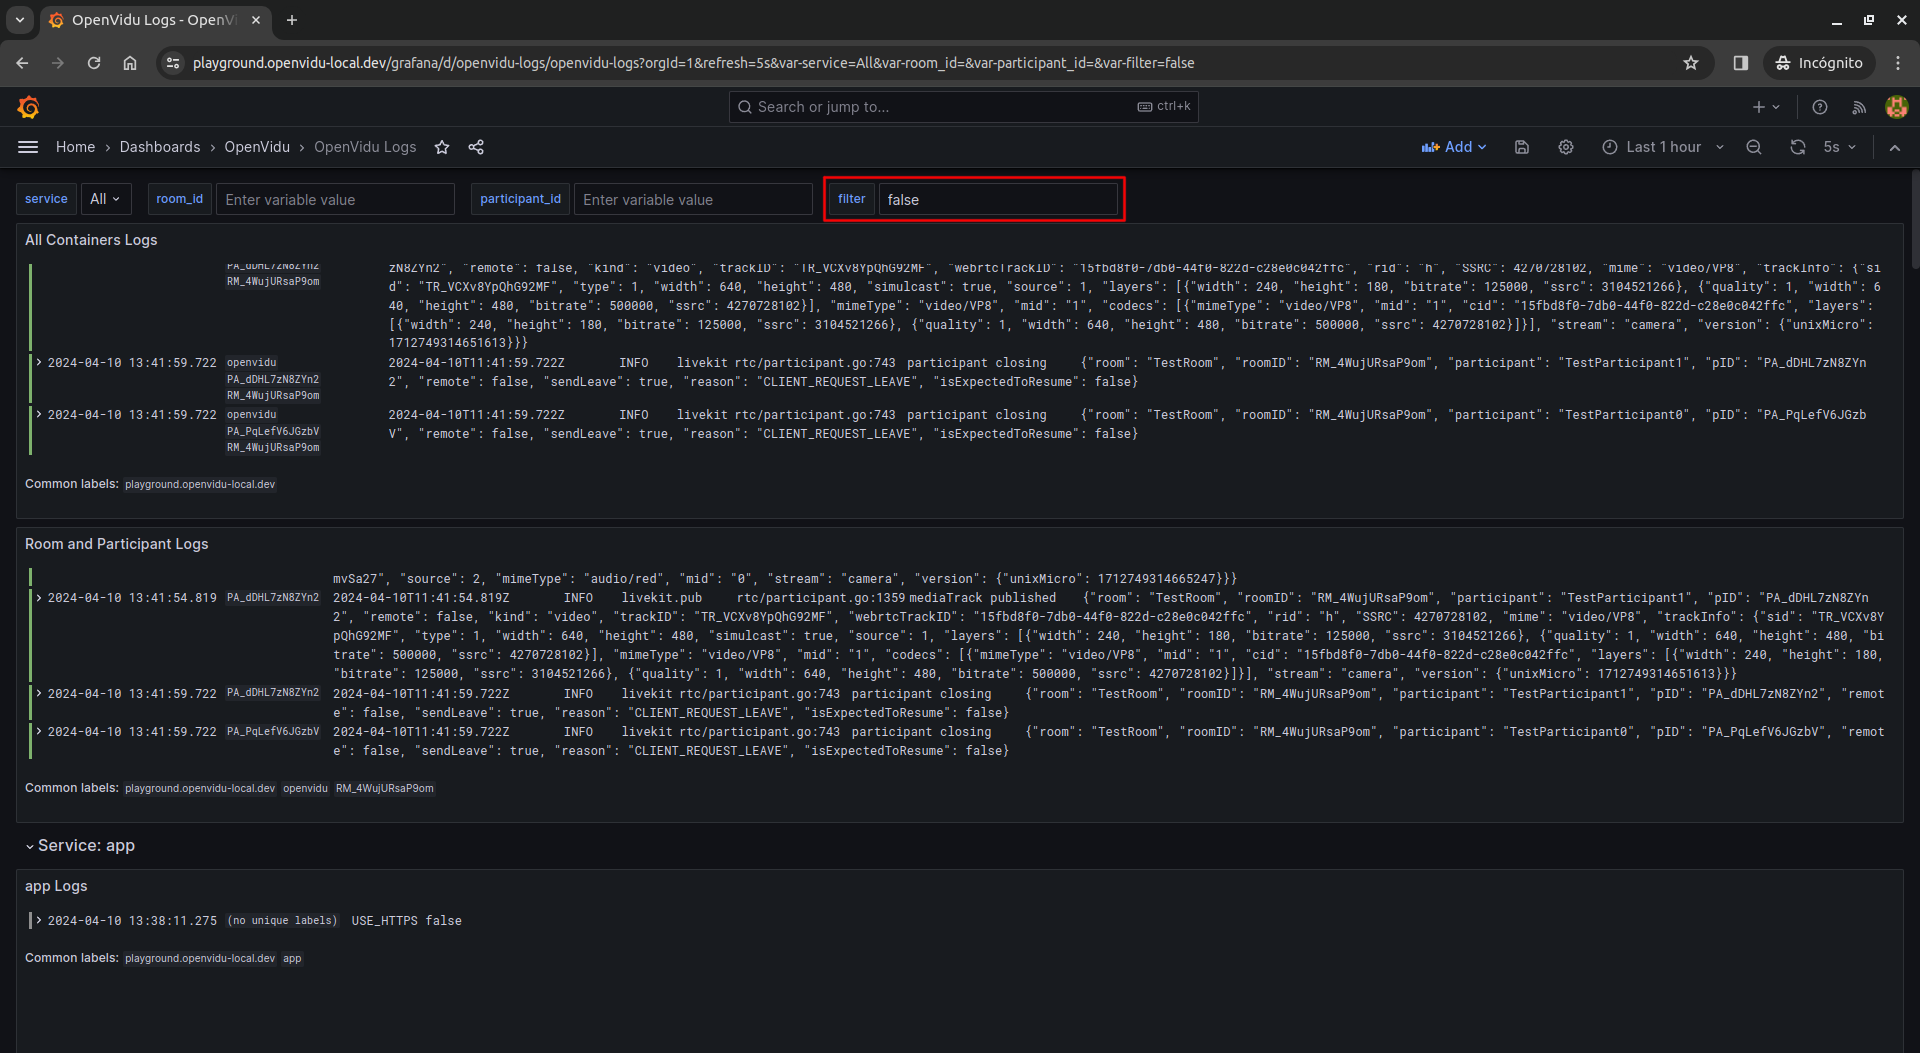
You can also filter logs containing a specific text by using the filter search box.
OpenVidu Cluster Nodes Logs#
This dashboard is part of OpenVidu PRO edition.
In case you are using OpenVidu PRO, this dashboard provides different visualizations for logs from your OpenVidu Elastic or OpenVidu High Availability cluster, grouped by node.
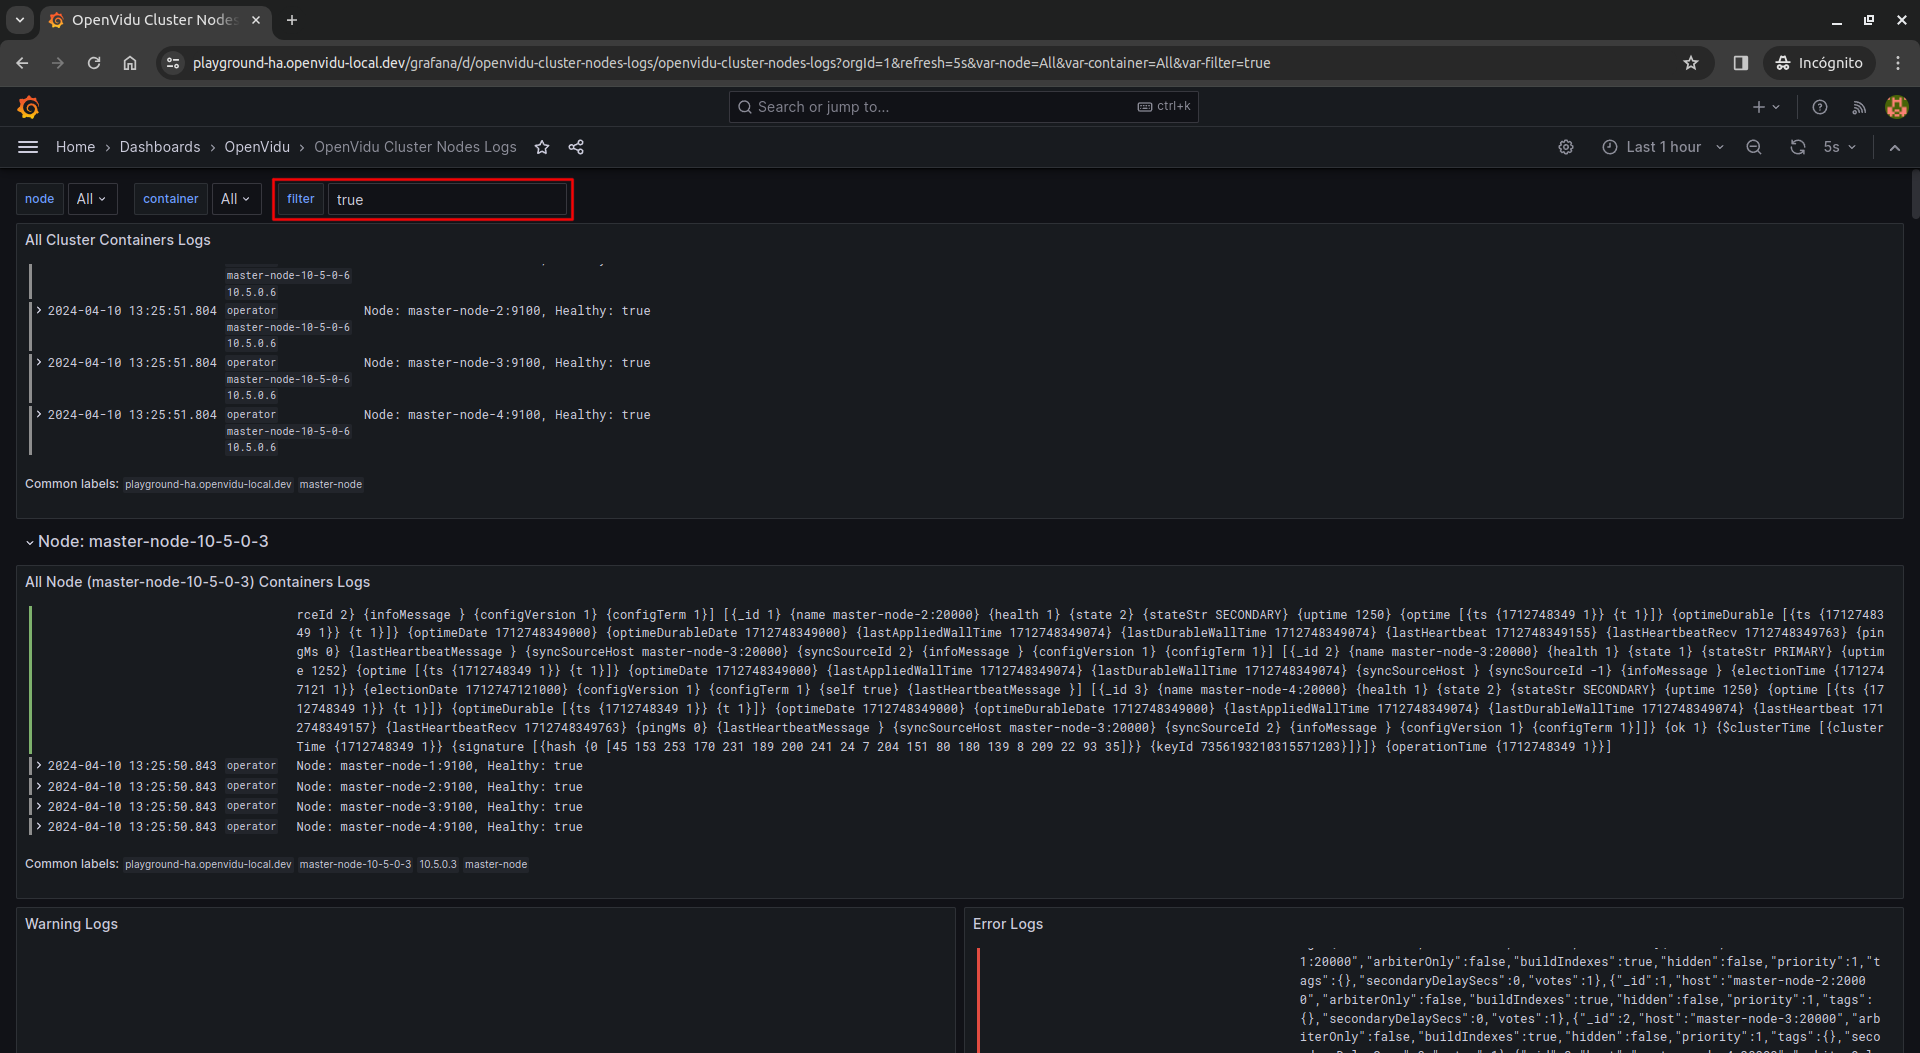
First of all, there is a panel showing all containers logs from all nodes.
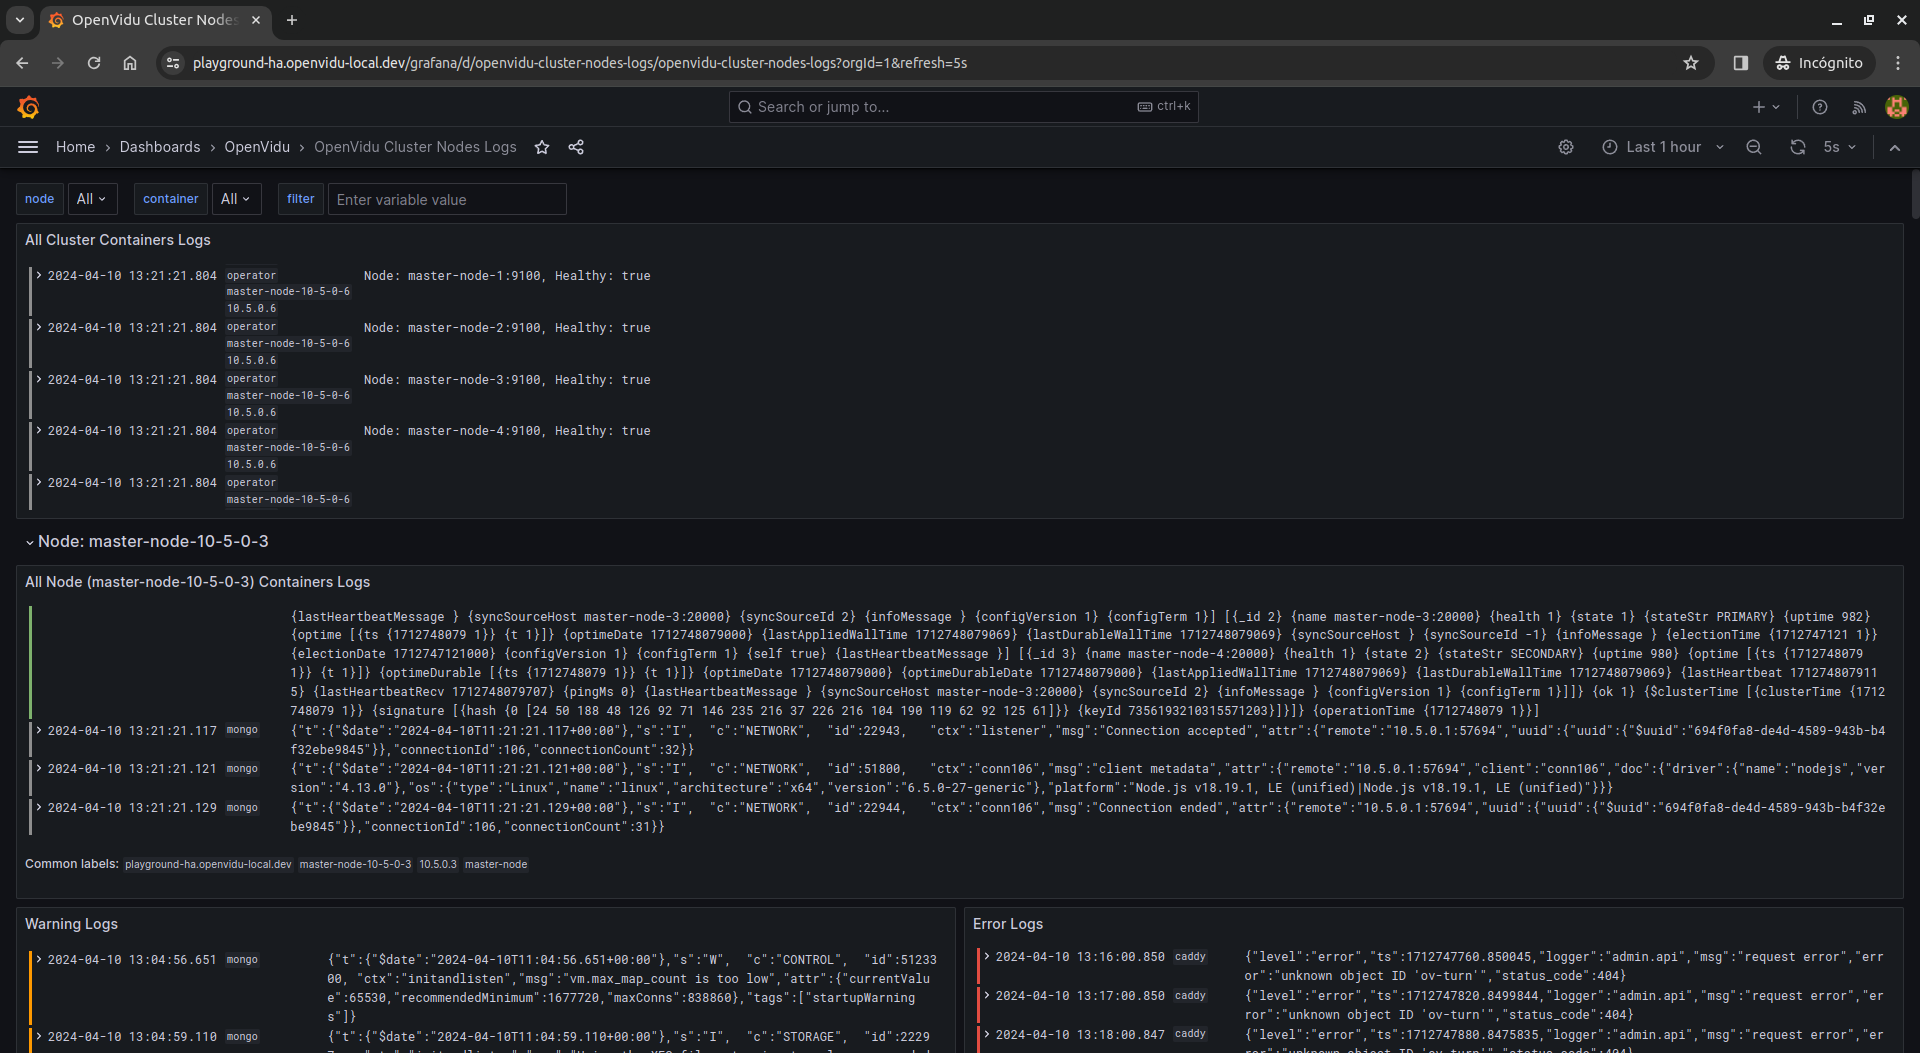
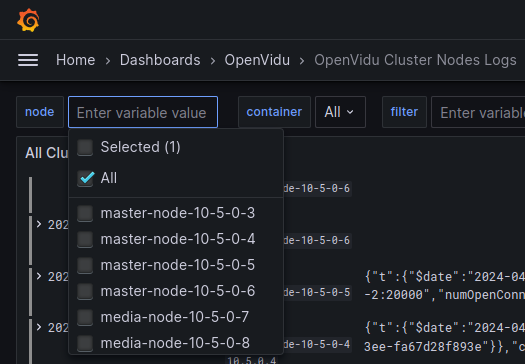
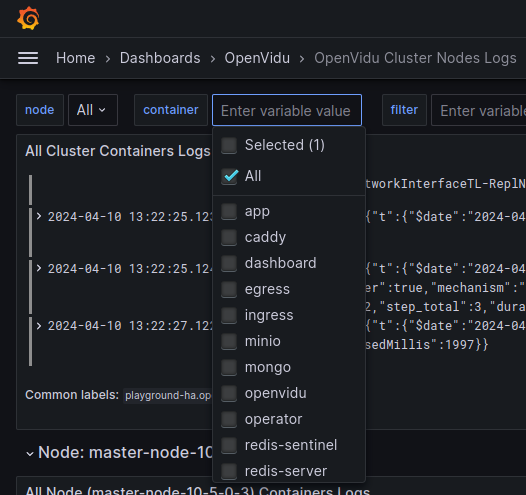
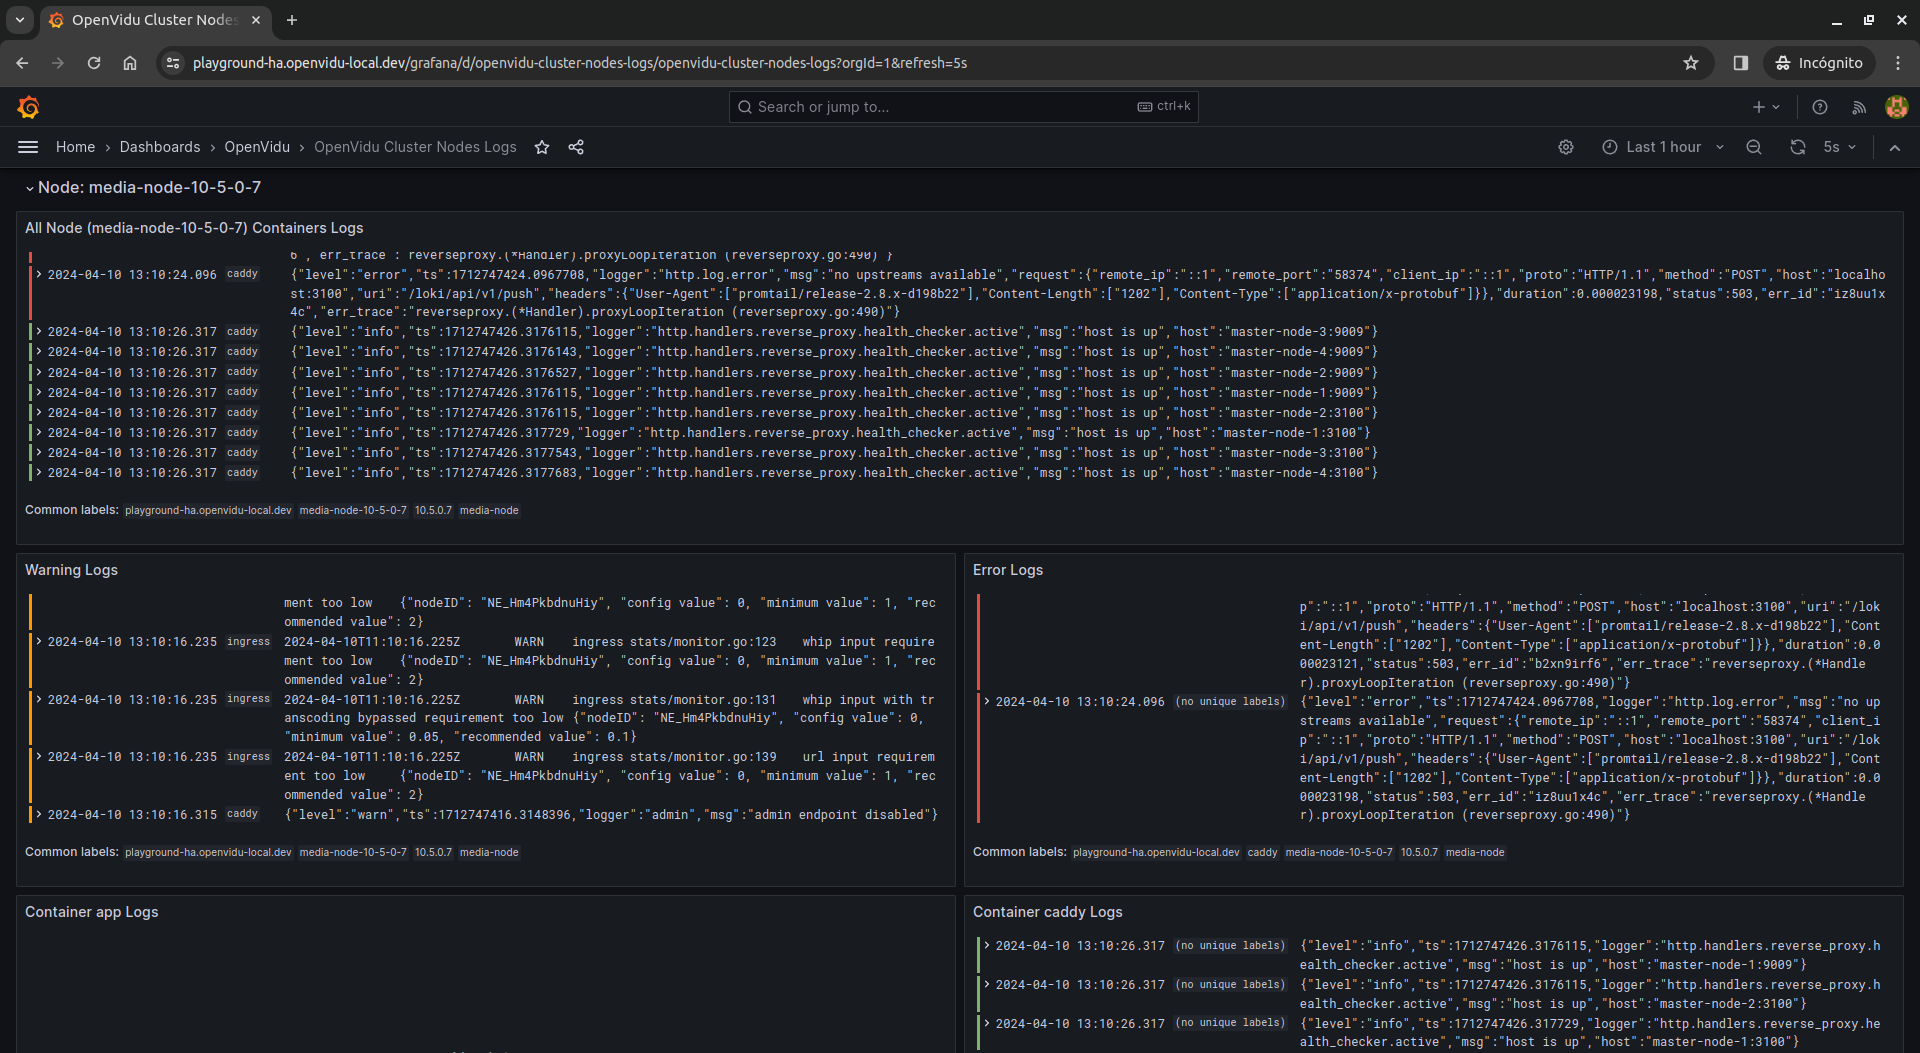
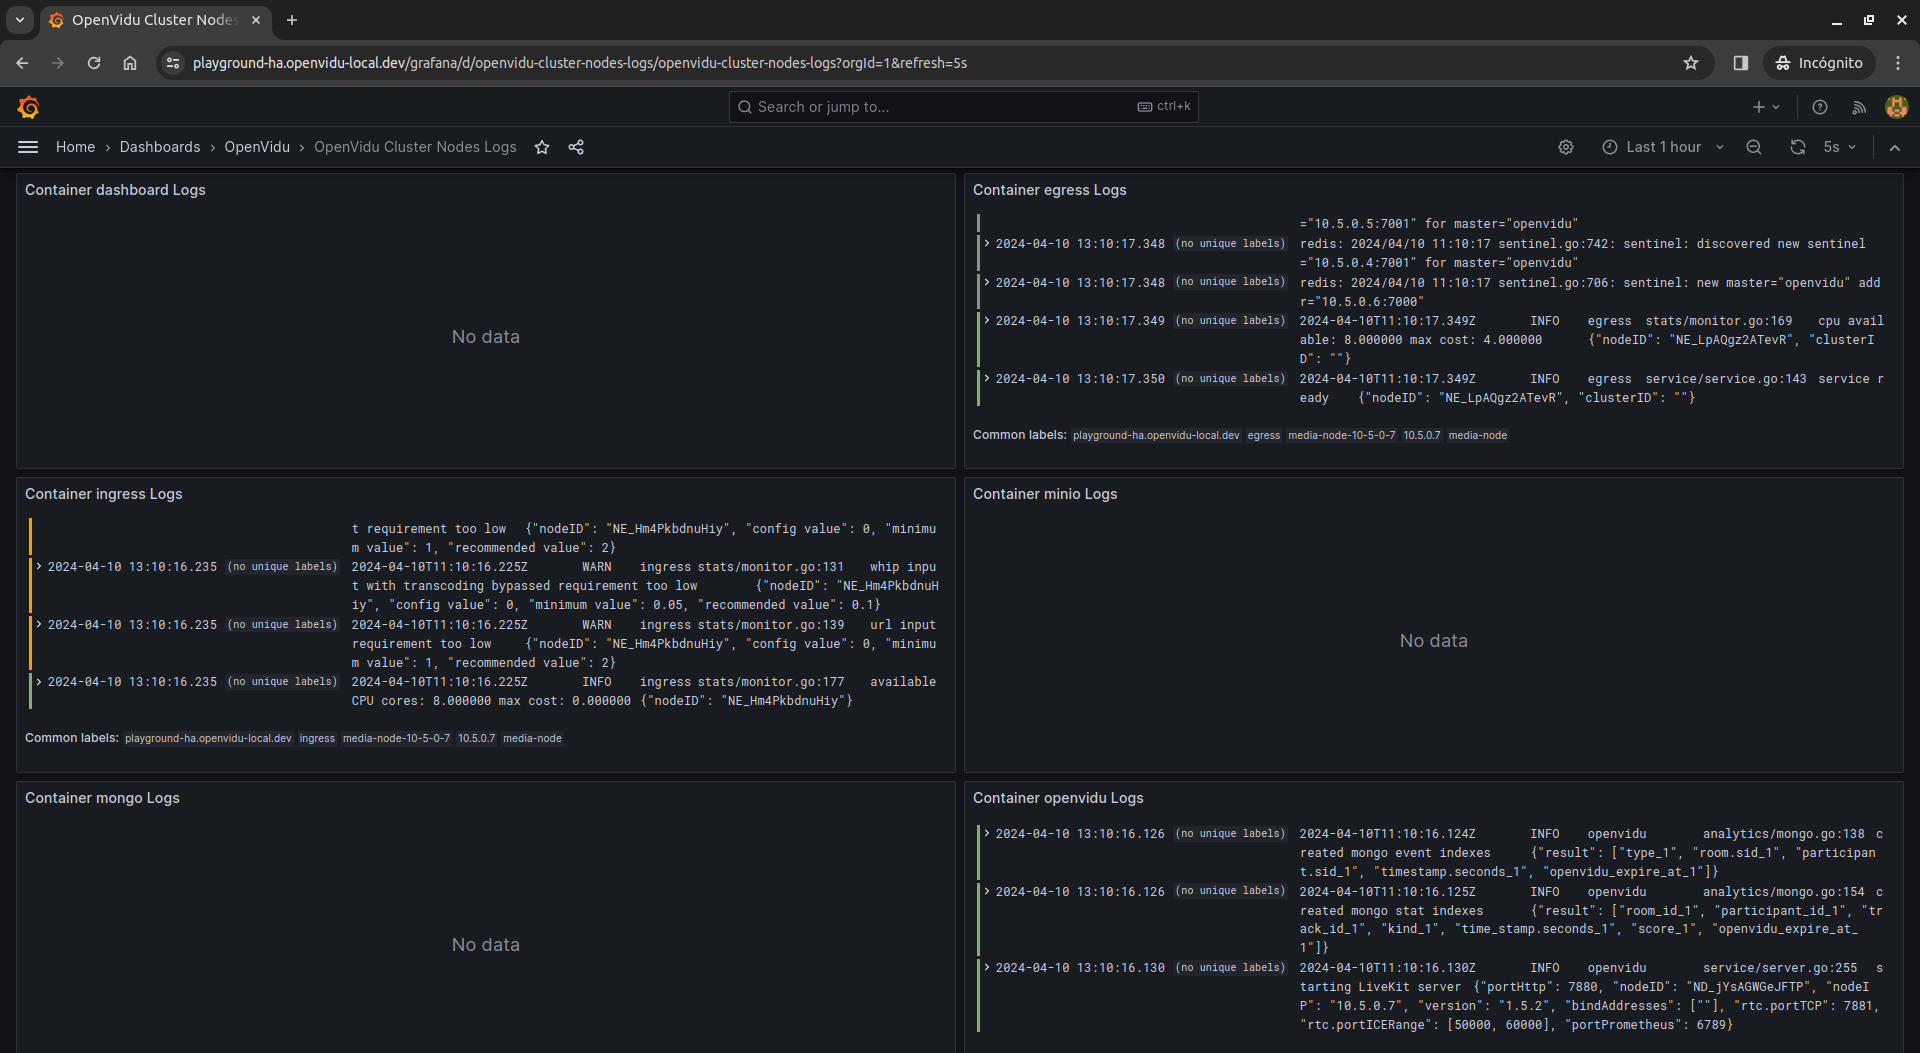
Then, there is a row for each selected node, containing all logs, warnings and errors from that node. Besides, each row contains a panel for each selected container, showing all its logs.
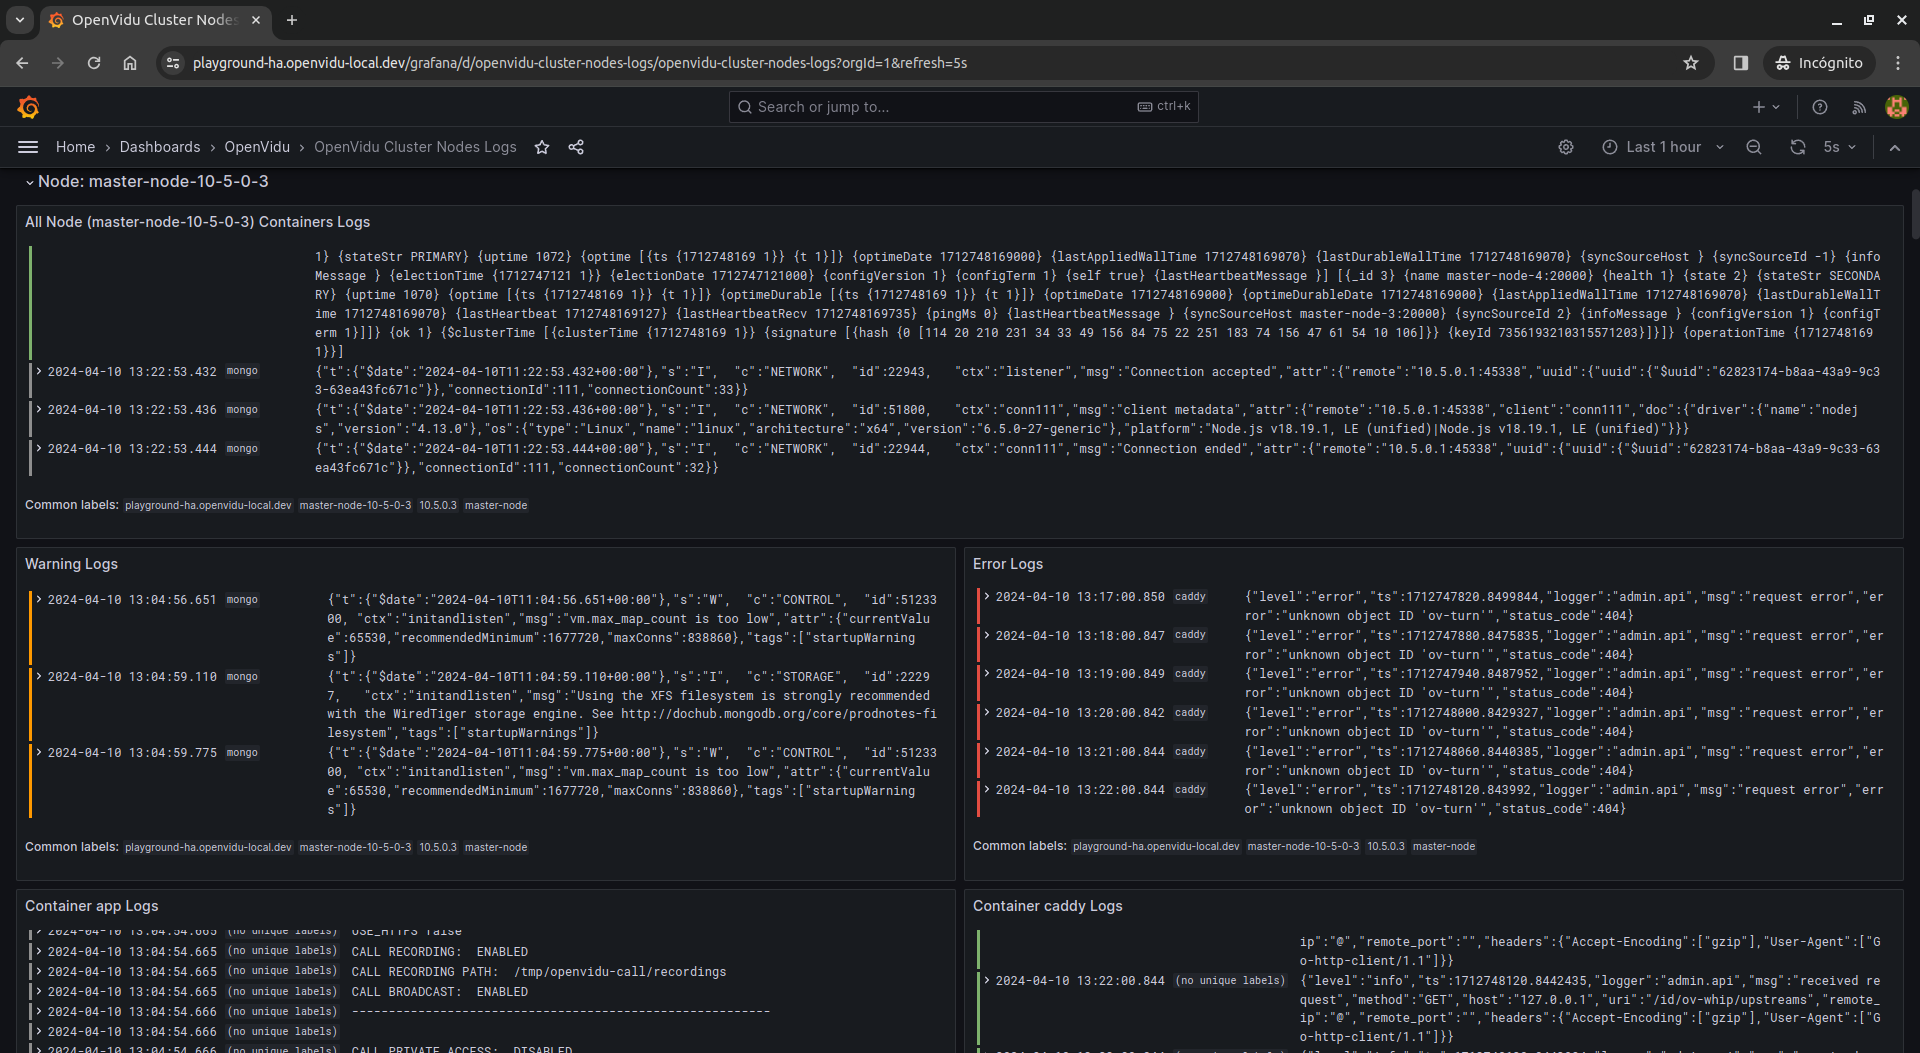
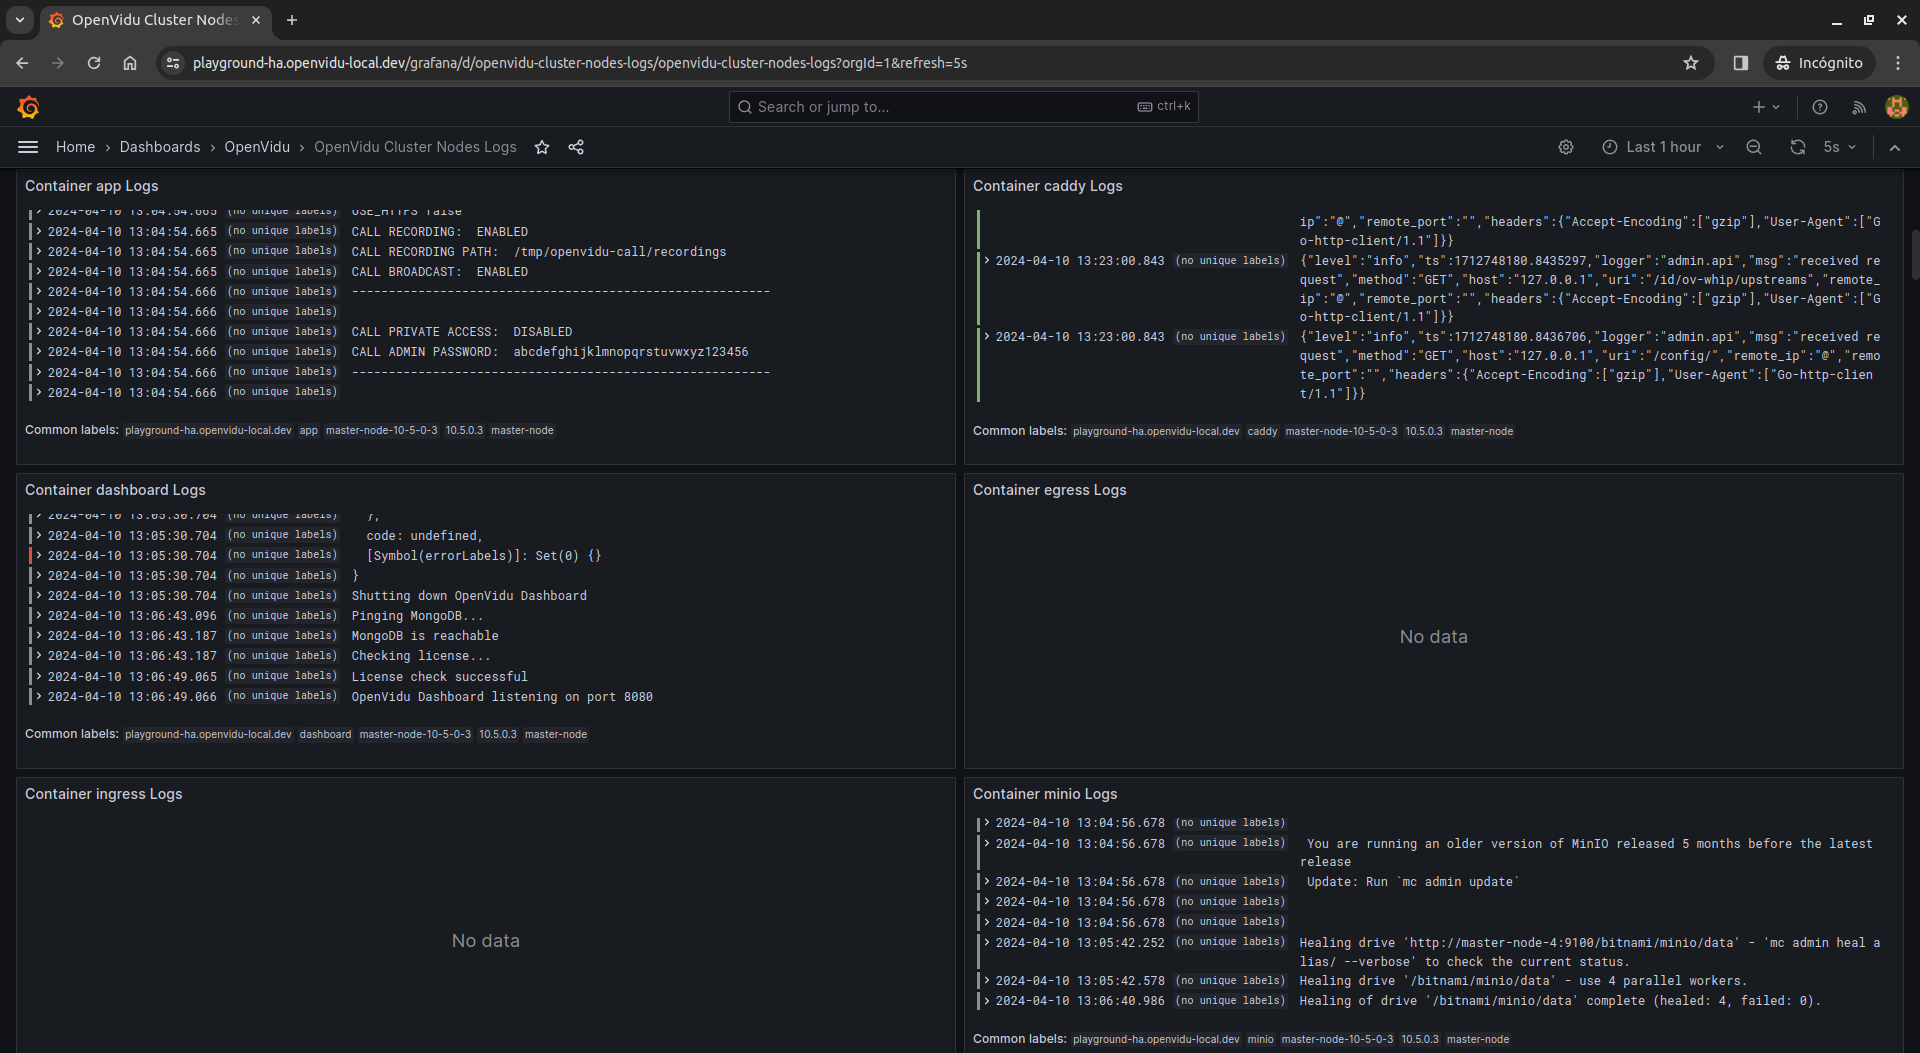
Info
Note that some panels have no data. This is because some containers are running in Master Nodes and others in Media Nodes.
You can also filter logs containing a specific text by using the filter search box.
OpenVidu Cluster Services Logs#
This dashboard is part of OpenVidu PRO edition.
In case you are using OpenVidu PRO, this dashboard provides different visualizations for logs from your OpenVidu Elastic or OpenVidu High Availability cluster, grouped by service.
First of all, there is a panel to filter logs by room_id and participant_id.
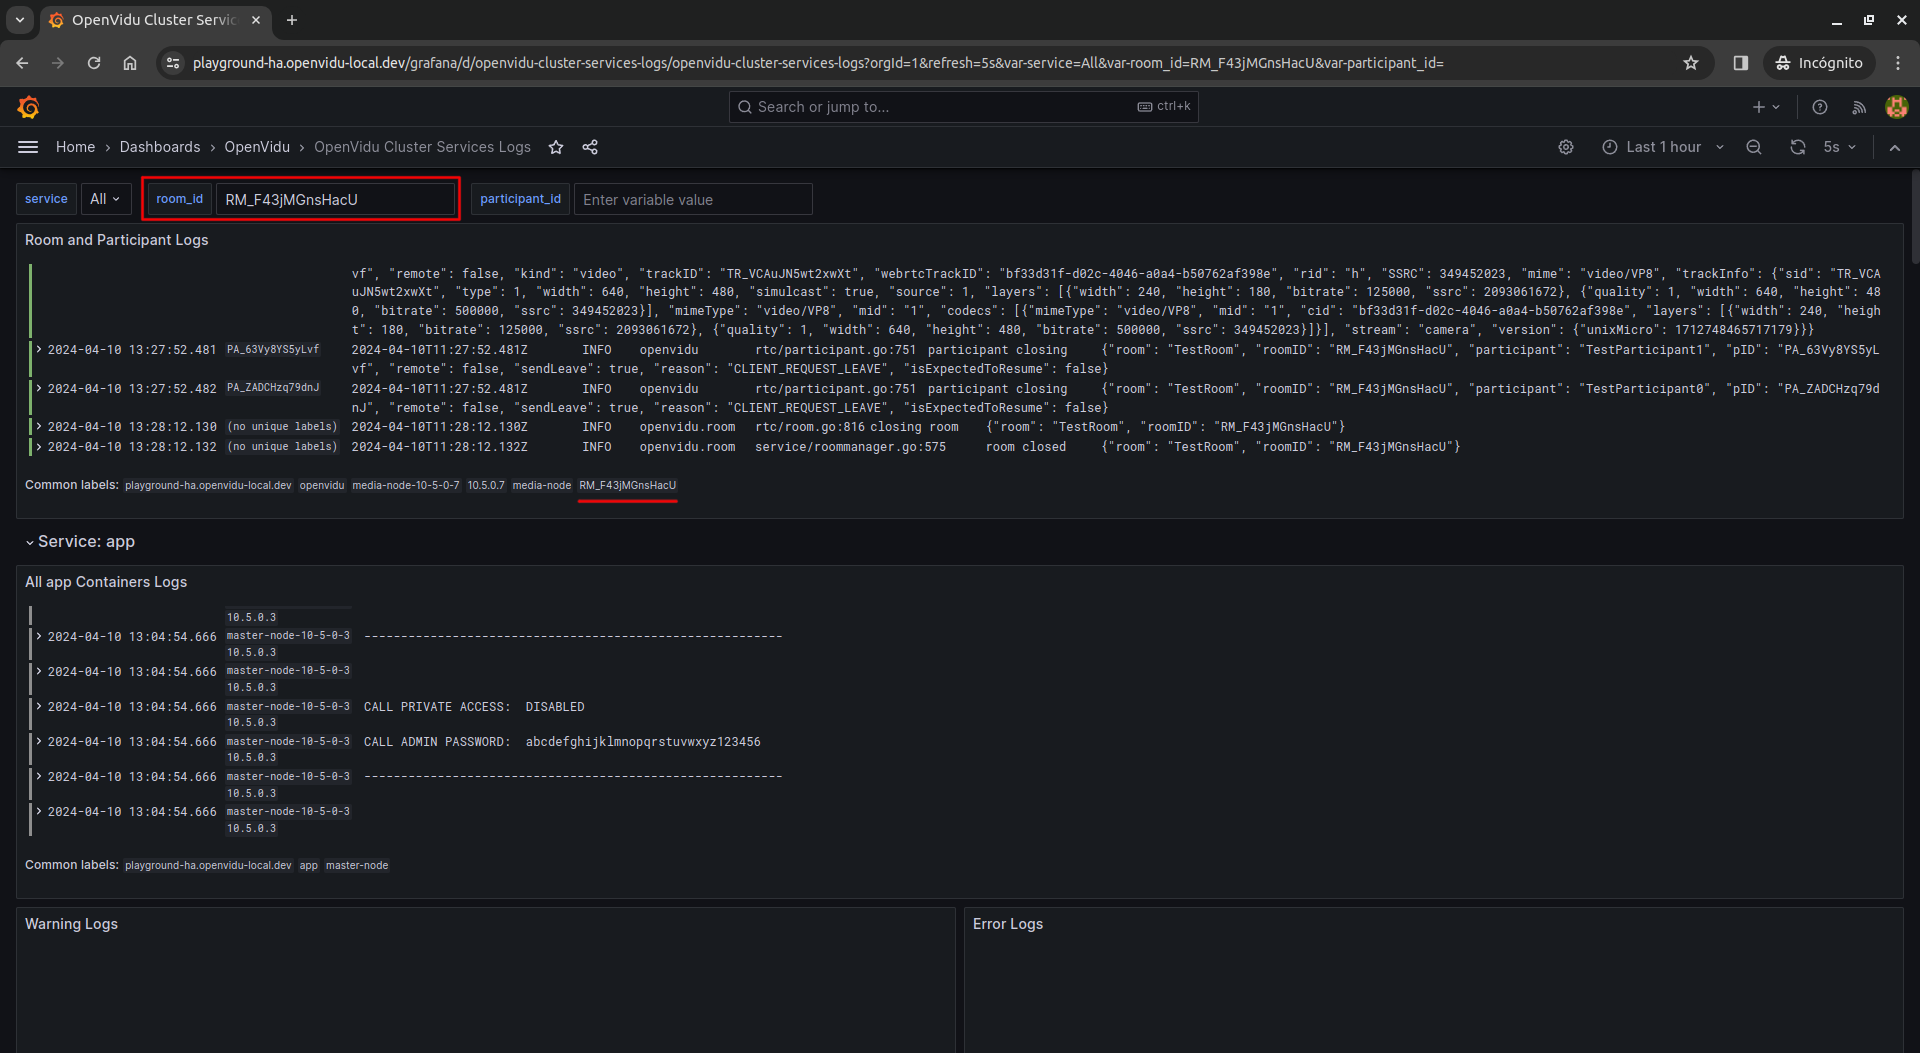
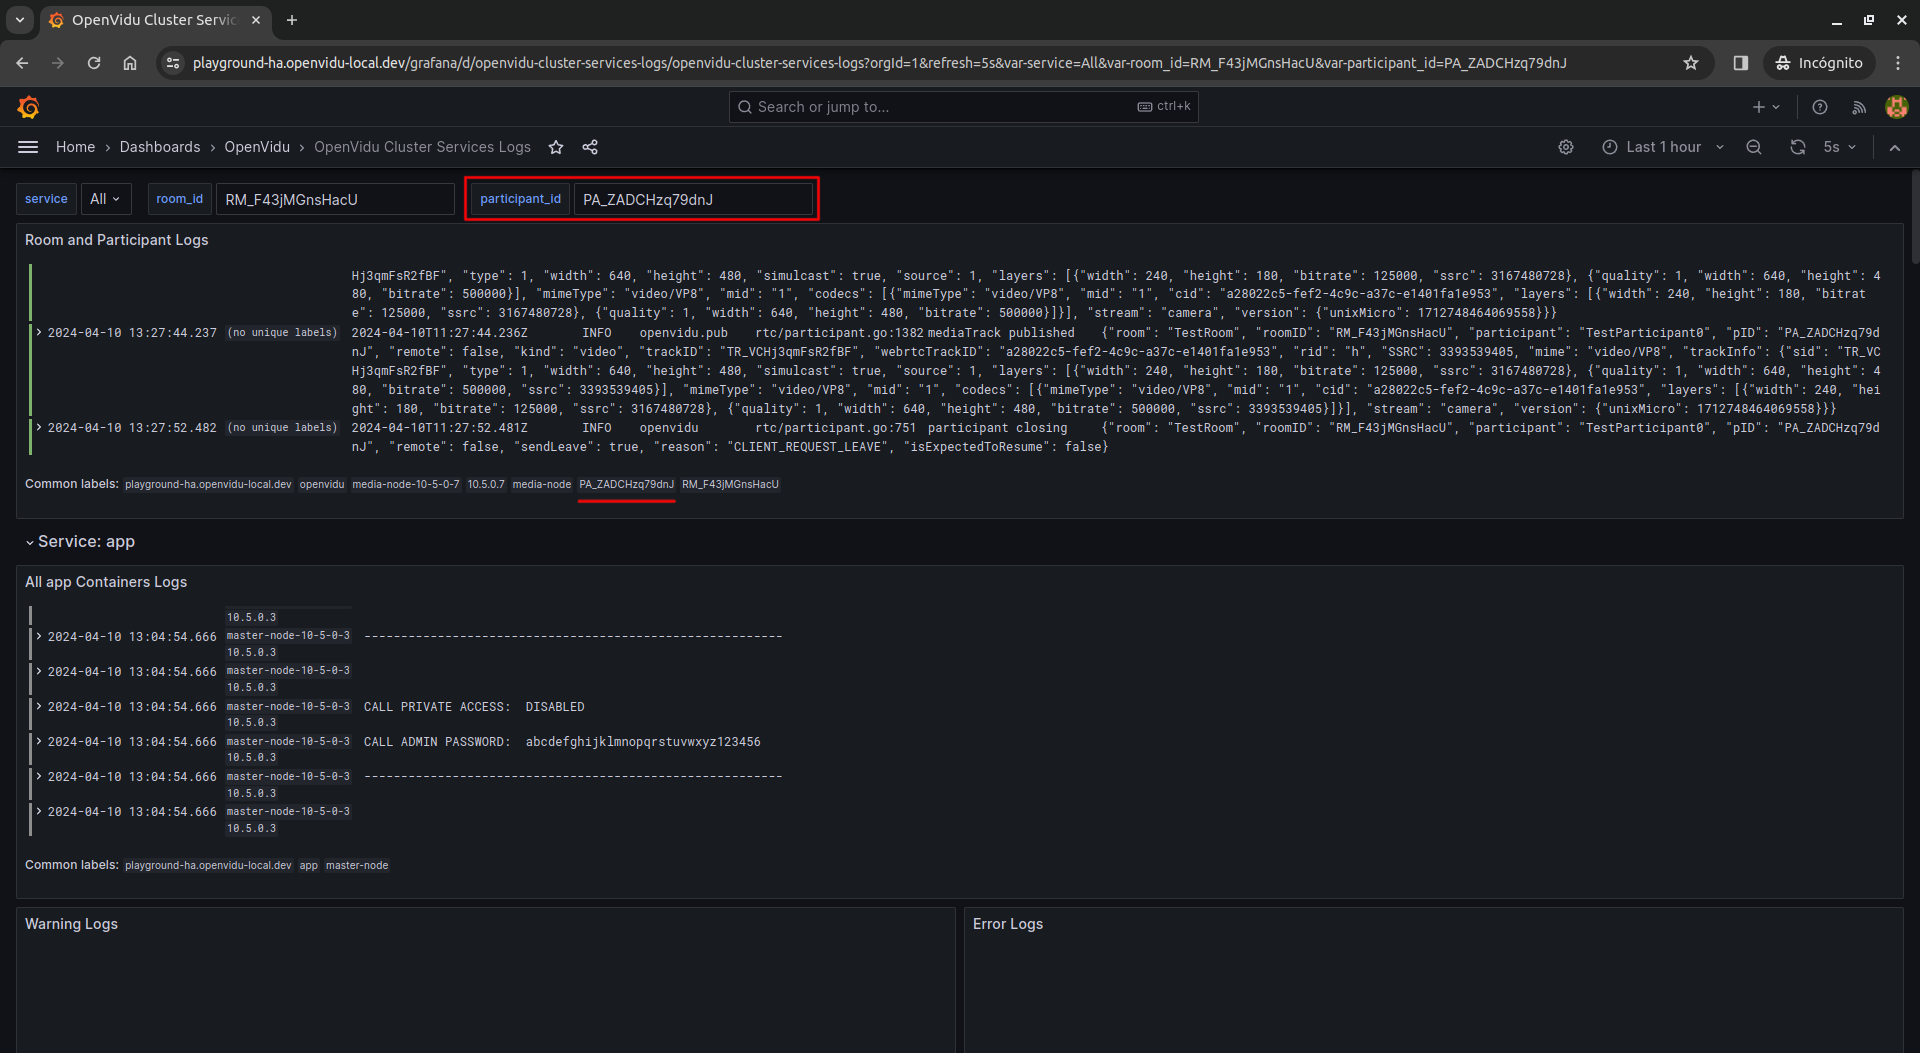
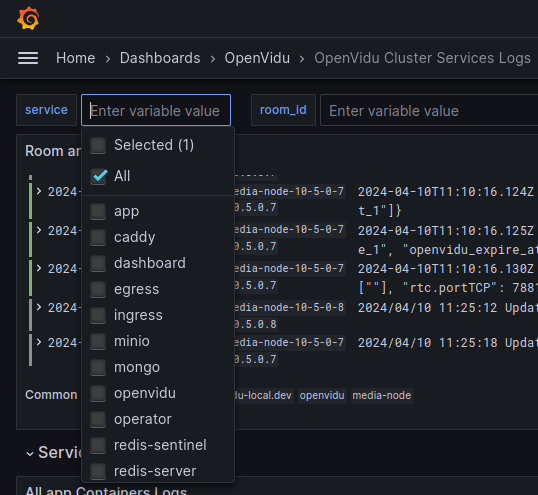
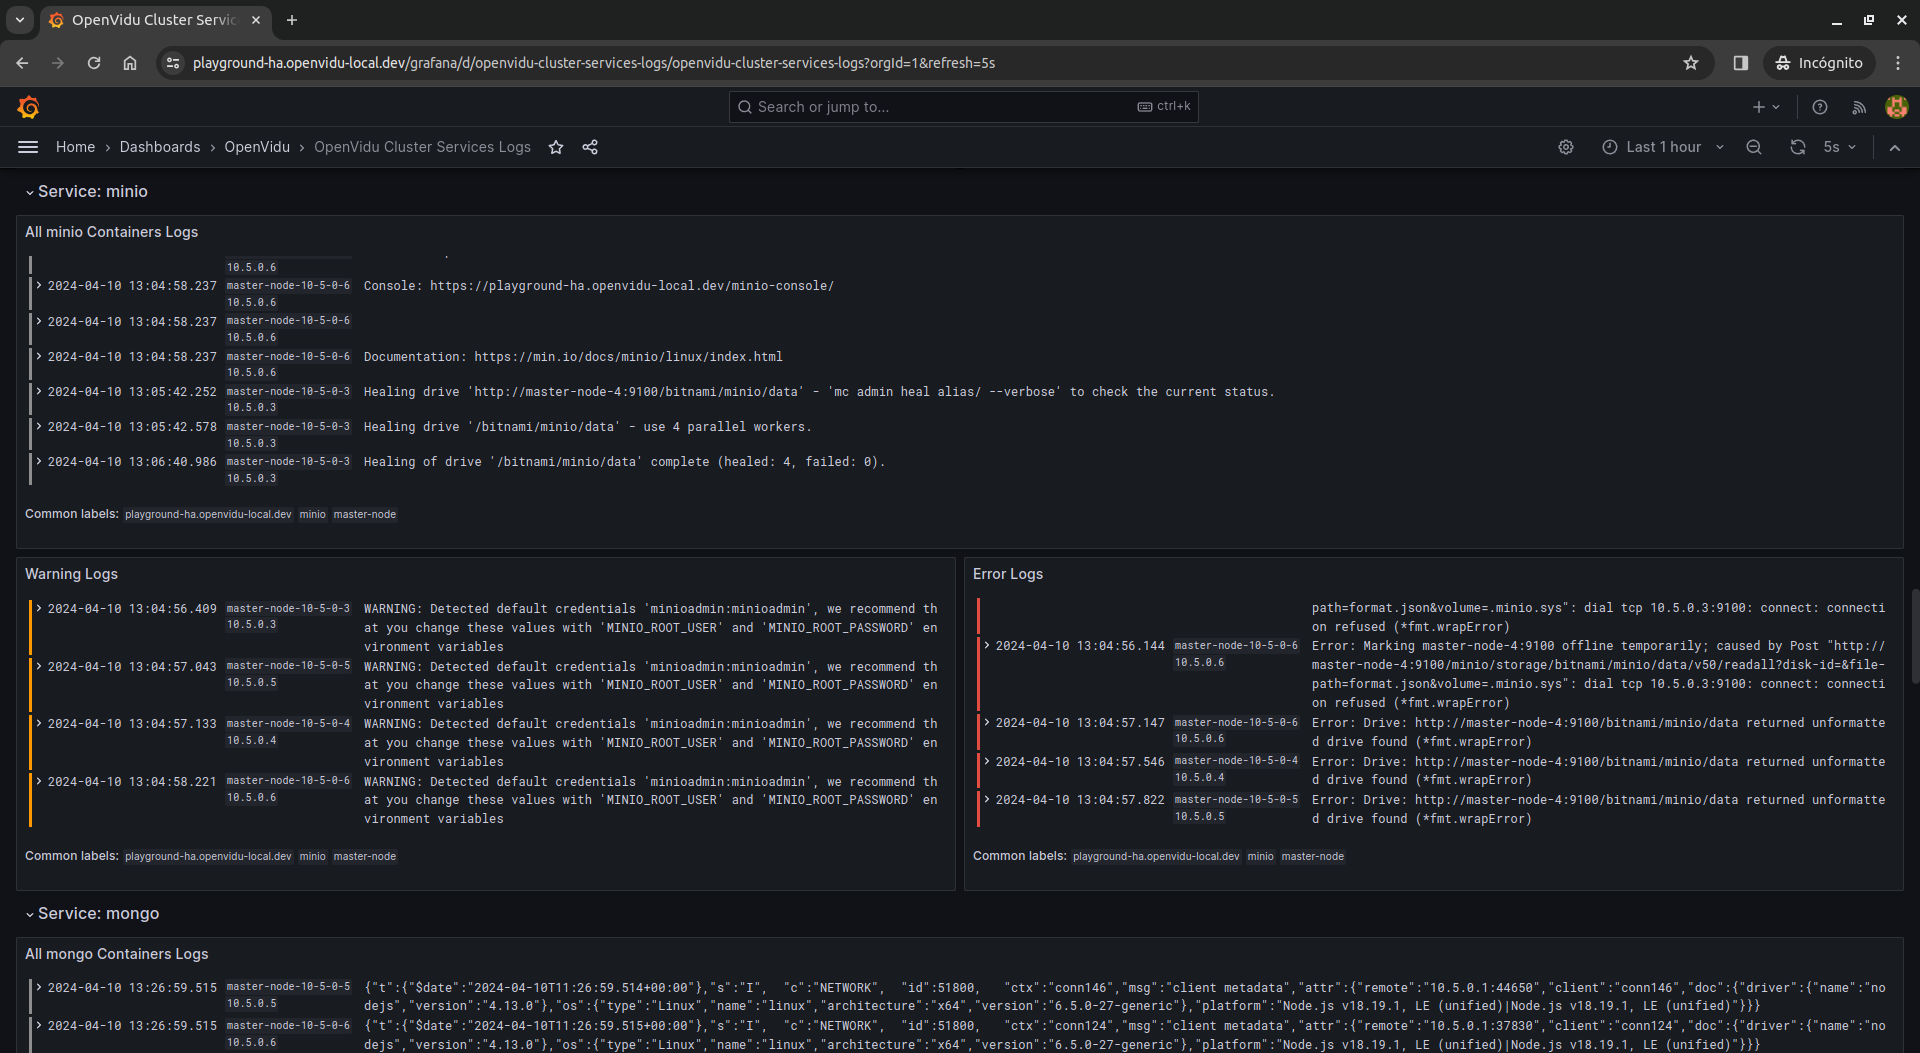
Then, there is a row for each selected service, containing all logs, warnings and errors from that service.
Limitations#
For now, in OpenVidu High Availability deployments, we have decided to not implement Grafana in High Availability (HA) mode. This decision is based on the fact that Grafana needs a configured HA MySQL or PostgreSQL database to work in HA mode, and we want to keep the deployment as simple as possible.
There are 4 instances of Grafana in an OpenVidu High Availability deployment, one for each Master Node, but they are not synchronized between them. Therefore, if you make any change (change your admin password, create a new dashboard...) in one Grafana instance and the Master Node suddenly goes down, you will be redirected to another Grafana instance where the changes will not be reflected. That is the reason why we disable user signups and saving dashboard or datasource modifications in Grafana.
However, all metrics and logs from all nodes are available in all Grafana instances, so you can monitor your OpenVidu cluster without any problem.